
Figure 9.
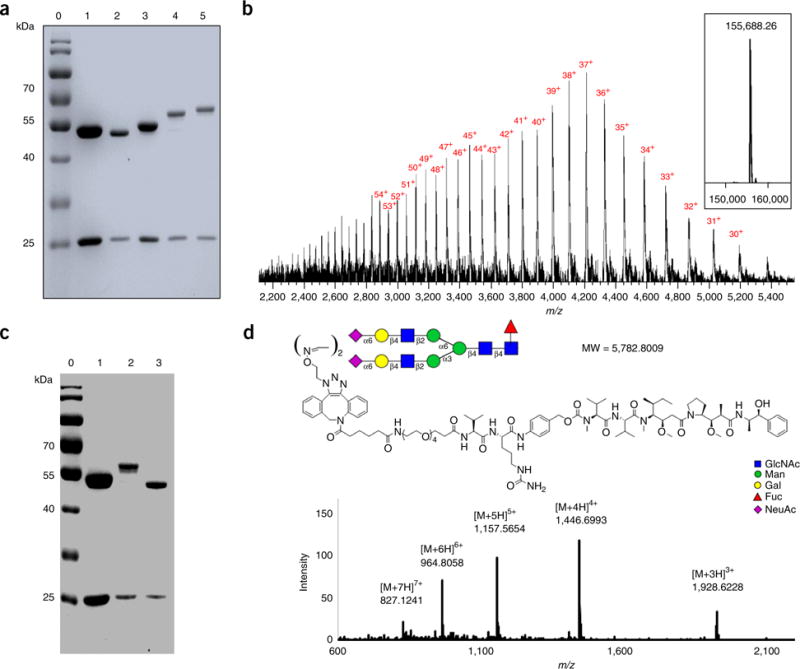
SDS-PAGE and LC–MS characterization of gsADC (7) (ref. 26). (a) SDS-PAGE analysis of 7b and 7c. Lane 0: marker, lane 1: commercial Herceptin, lane 2: Herceptin-Fucα1,6GlcNAc (2a), lane 3: glycoengineered Herceptin (5a), lanes 4 and 5: gsADC (7b and 7c). (b) LC–MS profiles for 7b. The multiple charged m/z data are labeled with charge numbers. The deconvolution mass spectrum is shown in the embedded box. (c) SDS-PAGE analysis of PNGase-F digestion of 7c. Lane 0: marker, lane 1: commercial Herceptin, lane 2: 7c, lane 3: 7c after PNGase-F digestion. (d) MS profile of the glycan–drug complex (shown with glycan symbol along with MMAE structure) released from 7c by PNGase-F digestion.