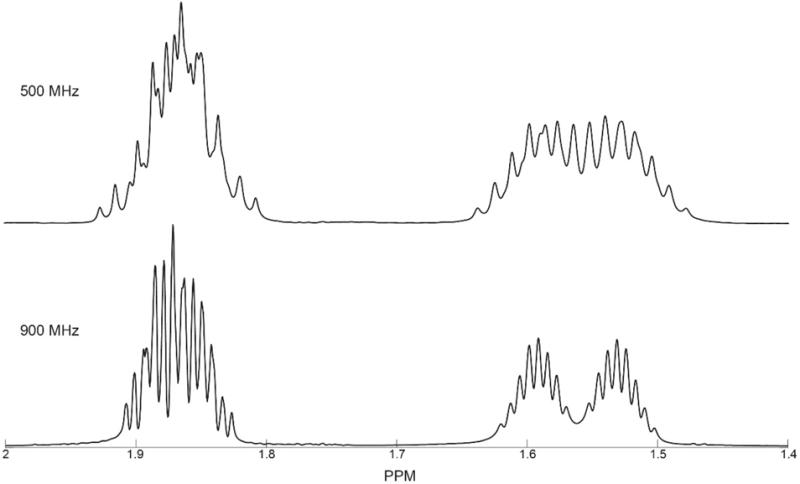
Figure 1.

Example of the effect of magnetic field strength on an NMR spectrum. 1D-1H spectra of L-citrulline collected at fields corresponding to 1H frequencies of (top) 500 MHz and (bottom) 900 MHz. Only a small spectral subdomain [1.4, 2] ppm is displayed. The 500 MHz spectrum is from the BioMagResBank (BMRB ID: bmse000032) small molecule database.18 Data were collected on Bruker spectrometers.
