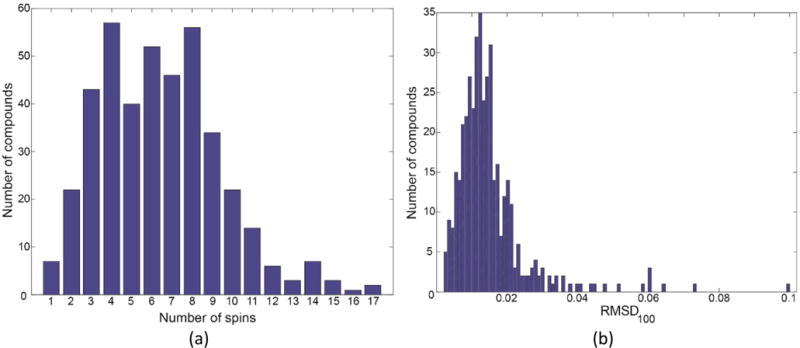
Figure 5.

Statistics on simulated spectra from 415 compounds. The histogram (a) shows the number of spins on the x-axis versus the corresponding number of compounds on the y-axis. (b) Histogram of the RMSD100 values representing the differences between the simulated and experimental spectra of these compounds.
