
Figure 6.
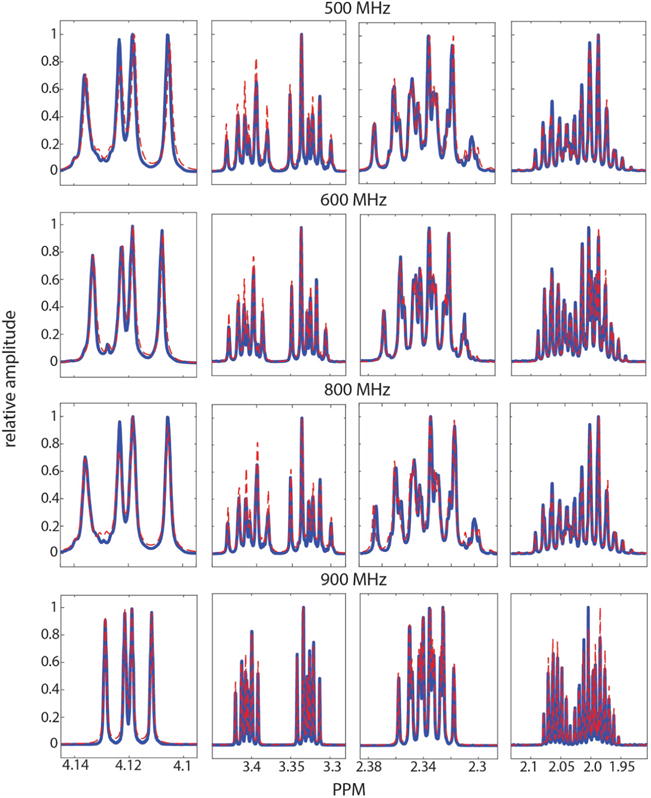
Comparison of experimental and simulated 1D-1H spectra of L-proline at different field strengths. We used GISSMO to optimize the spin system matrix of L-proline against an experimental spectrum obtained at 900 MHz. The extracted parameters were used to generate the simulated spectra at 500, 600, 800, and 900 MHz (red lines). These are compared to the experimental spectra of L-proline collected at the four field strengths (blue lines). Fitting of the simulated spectrum at 500 and 600 MHz was improved by adjusting the line width from 0.440 Hz, the value used for fitting the 900 MHz spectrum, to 0.526 Hz. The same line width is used for the 800 MHz as that for the 900 MHz spectrum.