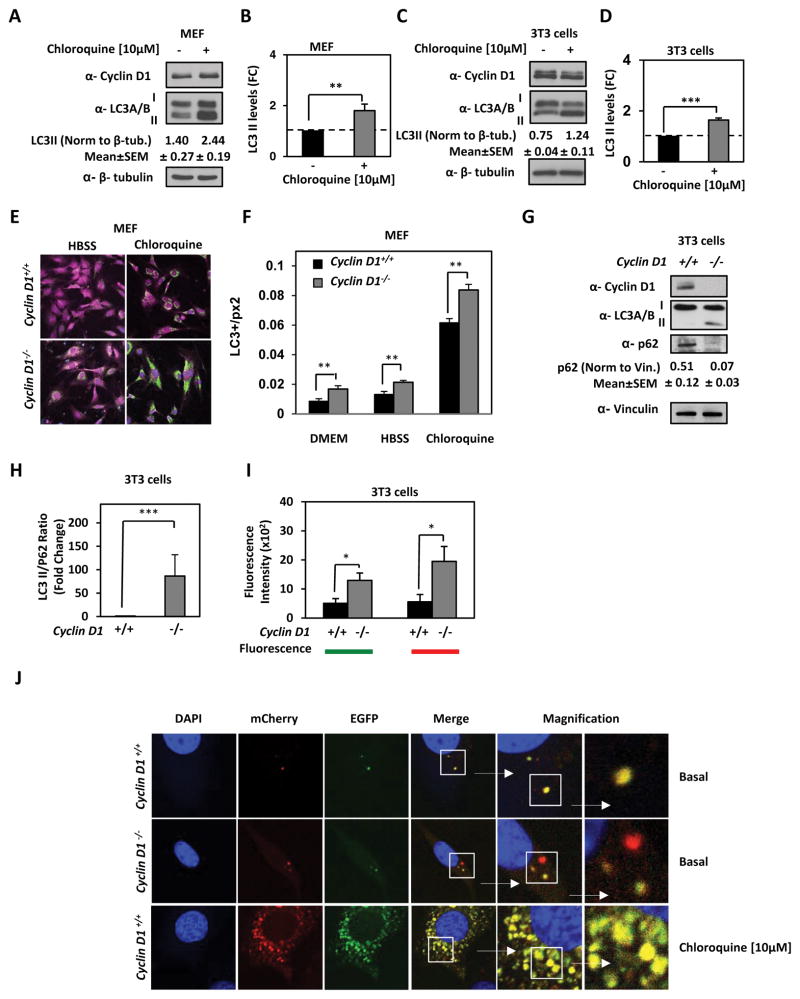
Figure 5. Cyclin D1 inhibits autophagic cargo flux by reducing AMPK phosphorylation.
Chloroquine induction of autophagy in (A) MEF and (C) 3T3 fibroblast cells. Protein lysates immunoblotted for cyclin D1, LC3A/B and β-tubulin. Relative abundance of LC3-II was quantitated for (B) MEF and (D) 3T3 fibroblast cells. (E) cyclin D1+/+ and cyclin D1−/− MEF were immunostained for LC3 (green) and actin (purple). (F) Quantitation of LC3 levels. The amounts of LC3 puncta were normalized by the total cell area expressed in square pixels. LC3 levels are increased in cyclin D1−/− MEF (n=12) vs cyclin D1+/+ MEF (n=6) cultured with regular media, in cyclin D1−/− MEF (n=6) vs cyclin D1+/+ MEF (n=7) in HBSS and in cyclin D1−/− MEF (n=23) vs cyclin D1+/+ MEF (n=24) treated with chloroquine (**P<0.01 for number of stated cells, and average LC3 puncta depicted ±SEM). (G) Autophagic flux assayed by Western blot for p62 and LC3A/B lapidated form. Abundance of autophagic flux markers were normalized to vinculin and graphically represented as (H) LC3II/p62 ratio. (**; P<0.01 and ***; P<0.001).

