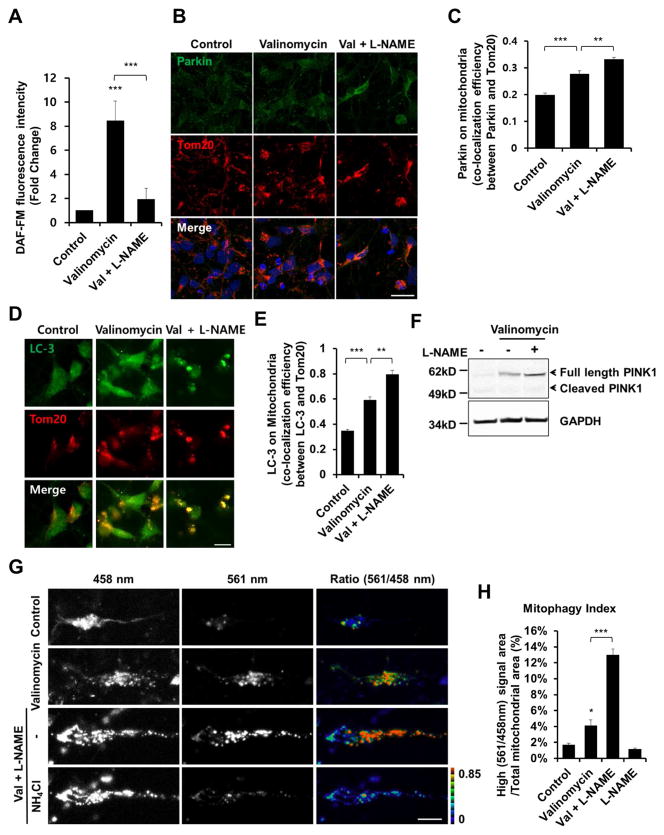
Figure 5. Mitochondrial Insult Induces Mitophagy in hiPSC-DA Neurons.
(A) hiPSC-DA neurons were exposed for 9 hr to 1 μM valinomycin in the presence or absence of 1 mM L-NAME. To monitor NO, cells were incubated with 2.5 μM DAF-FM for 30 min. Data are mean + SEM from five random fields in each experiment; ***p < 0.001 by ANOVA; n = 3 experiments.
(B) hiPSC-DA neurons were exposed for 9 hr to 250 nM valinomycin in the presence or absence of 1 mM L-NAME, and immunostained for Parkin and Tom20. Scale bar, 20 μm.
(C) Parkin translocation to the mitochondrial membrane assessed by co-localization with Tom20. Data are mean + SEM from three random fields in each experiment; ***p < 0.001; **p < 0.01 by ANOVA; n = 3 experiments.
(D) hiPSC-DA neurons were exposed for 9 hr to 250 nM valinomycin in the presence or absence of 1 mM L-NAME, and then immunostained for LC3 and Tom20. Scale bar, 10 μm.
(E) LC3 translocation to the mitochondrial membrane assessed by co-localization with Tom20. Data are mean + SEM from three random fields in each experiment; ***p < 0.001; **p < 0.01 by ANOVA; n = 3 experiments.
(F) hiPSC-DA neurons were exposed for 9 hr to 1 μM valinomycin in the presence or absence of 1 mM L-NAME; lysates were then immunoblotted for PINK1 and GAPDH.
(G) hiPSC-DA neurons were electroporated with mt-Keima. Transfected cells were exposed to 250 nM valinomycin for 16 hr in the presence or absence of L-NAME, and imaged following excitation at 458 nm and 561 nm. After obtaining an initial set of images (top three rows), 50 mM NH4Cl was added to neutralize the pH in the lysosomal lumen before acquiring a second set of images (bottom row); this reversed the high-ratio (561 nm/458 nm) to low-ratio signal (Bingol et al., 2014). Scale bar, 10 μm.
(H) Quantification of mitophagy index in three random fields in each experiment. Data are mean + SEM; ***p < 0.001; *p < 0.05 by ANOVA; n = 3 experiments.

