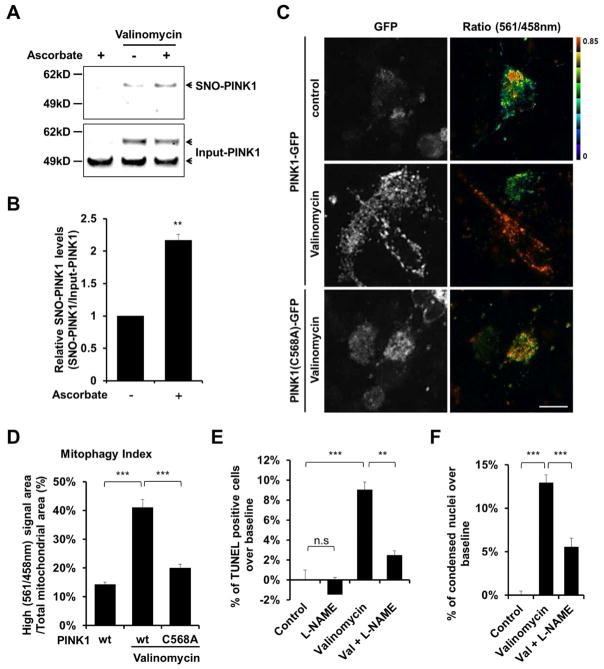
Figure 6. S-Nitrosylation of PINK1 Decreases Mitophagy in hiPSC-DA Neurons Exposed to Valinomycin.
(A) hiPSC-DA neurons were exposed to 250 nM valinomycin for 3 hr. Cell lysates were then subjected to biotin-switch assay to detect endogenous SNO-PINK1. Control was performed in the absence of ascorbate. SNO-PINK1 and Input-PINK1 were detected by immunoblotting with anti-PINK1 antibody.
(B) Ratio of SNO-PINK1/Input-PINK1 from hiPSC-DA neurons. Data are mean + SEM; **p < 0.01; n = 3 experiments.
(C) hiPSC-DA neurons were electroporated with mt-Keima and wt PINK1-GFP or mutant PINK1(C568A)-GFP. Subsequently, transfected cells were exposed to 250 nM valinomycin for 16 hr and imaged for mt-Keima and GFP. Scale bar, 20 μm.
(D) Mitophagy index determined from three random fields in each experiment. Data are mean + SEM; ***p < 0.001 by ANOVA; n = 3 experiments.
(E and F) hiPSC-DA neurons were exposed for 9 hr to 250 nM valinomycin in the presence or absence of 1 mM L-NAME. Cells were then fixed with 4% PFA and assayed for apoptotic neurons by TUNEL (total number of cells was assessed by Hoechst nuclear staining [E], see Figure S6A) and by the presence of condensed nuclei stained with Hoechst dye (F). Data are mean + SEM from three random fields in each experiment; ***p < 0.001 by ANOVA; n = 3 experiments.

