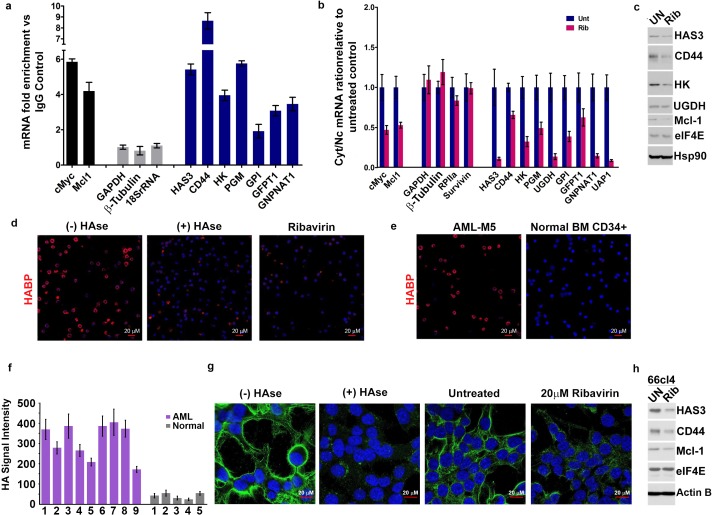
Figure 3. eIF4E elevates HA in cancer cell lines and primary specimens.
(A) RT-qPCR of HA synthesizing enzymes and its receptor CD44 following RNA immunoprecipitation (RIP) from nuclei of MM-6 cells using anti-eIF4E antibody. Data are presented as fold change relative to IgG controls. c-Myc and Mcl-1 served as endogenous eIF4E targets, while GAPDH, β-Tubulin and 18SrRNA served as a negative control. (B) RT-qPCR of HA synthesizing enzymes in cytoplasmic versus nuclear fractions of MM-6 cells treated with Ribavirin (Rib). Data are normalized to untreated control. Error bars are means ± S.D. c-Myc and Mcl-1 served as positive controls since they are known eIF4E targets, while GAPDH, β-Tubulin, RPIIa and Survivin served as negative controls. (C) Western blot of HA synthesizing enzymes and CD44 as a function of Ribavirin treatment in MM-6 cell line. Mcl-1 served as endogenous eIF4E target, while Hsp90 served as a loading control. (D) Fluorescence staining of HA (in red) in MM-6 cell lines treated with Ribavirin (Rib) versus untreated (UN) in the presence or absence of Hyaluronidase treatment. DAPI is in blue. A 63x objective with no digital zoom was used. (E) Fluorescence staining of HA (in red) in human CD34+ specimens from healthy volunteer compared with leukemic cells from M5 AML Patient. (F) Quantification of HA fluorescence staining in 9 M4/M5 AML patients and CD34+ specimens from five healthy volunteers using ZEN software. HA signal intensity is presented as the geometric means of the HA signal. The mean ± standard deviations are shown. (G) Fluorescence staining of HA (in green) in 66cl4 cells in the presence or absence of Hyaluronidase or Ribavirin treatment. DAPI is in blue. A × 63 objective with no digital zoom used. (H) Western blot control of HAS3 and CD44 as a function of ribavirin treatment in 66cl4 cell line. Mcl-1 served as endogenous eIF4E target, while ActinB served as loading control. Experiments were carried out in triplicate, at least three independent times. For bar graphs, the mean ±standard deviation are shown.


