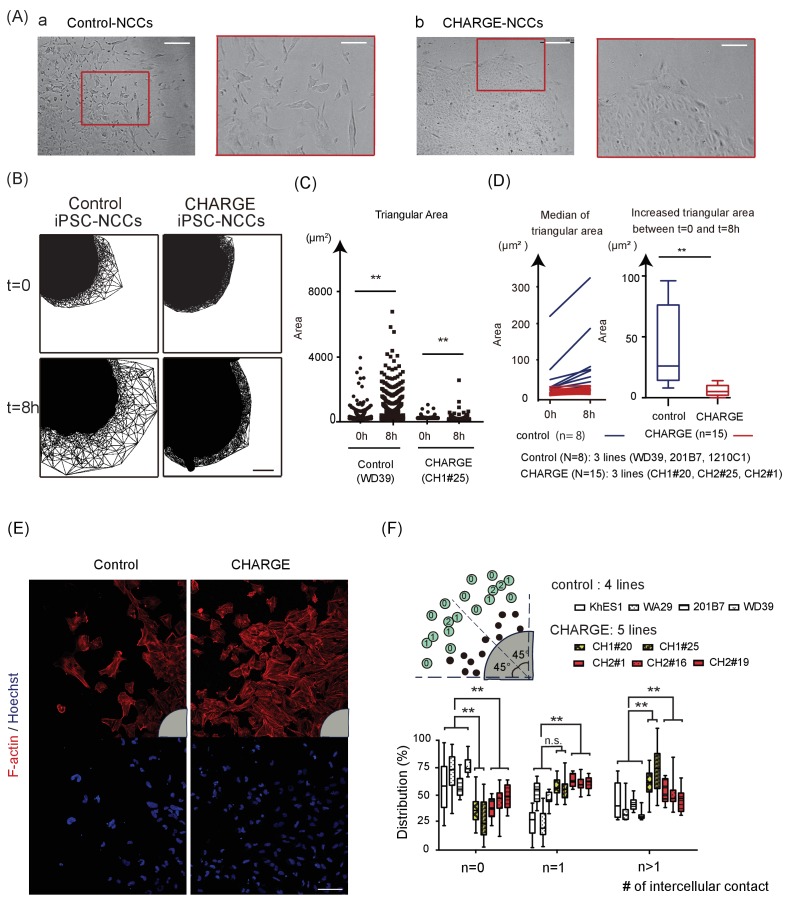
Figure 4. Defective Scattering of CHARGE iPSC-NCCs in vitro.
(A) Representative images of control and CHARGE iPSC-NCCs obtained by Method A. The control iPSC-NCCs residing at the outermost periphery began to scatter apart (Figure 4A–a). In contrast, the CHARGE iPSC-NCCs exhibited a distinct behavior in Phase 2, remaining closely associated with their neighbors (Figure 4A–b). The red square on the left corresponds to that on the right in both a and b. Bars (left in a and b): 250 μm. Bars (right in a and b): 100 μm. (B) Cell dispersion at t = 0, and t = 8 hr was analyzed using the Delaunay triangulation algorithm. Control: WD39; CHARGE: CH1#25. Bar:100 μm. (C) Dot plots represent the distribution of each triangular area shown in (B). (Left) Triangular area of the control iPSC-NCCs at t = 0 and t = 8 hr. **p<0.01 (Mann-Whitney U test, Cohen’s d 0.39). (Right) Triangular area of the CHARGE iPSC-NCCs at t = 0 and t = 8 hr. **p<0.01 (Mann-Whitney U test, Cohen’s d 0.03). (D) Blue bars represent for control iPSC-NCCs, and red bars represent for CHARGE iPSC-NCCs. (Left) Median of the triangular area of the control and CHARGE iPSC-NCCs at t = 0 and t = 8 hr. Control iPSC-NCCs, N = 8 (WD39, 201B7, 1201C1); CHARGE iPSC-NCCs, N = 15 (CH1#20, CH1#25, CH2#1). (Right) Box plots showing the increased median value of the triangular area from t = 0 to t = 8 hr. **p<0.01 (Mann-Whitney U test, Cohen’s d 1.66). (E) Representative images of iPSCs-NCCs at the outermost periphery visualized with F-actin and nuclear staining. Bar: 100 μm. Gray quarter circles show the postion of each sphere. (F) The outermost nine cells (green circle) in each of the eight 45 degree-sector of a sphere were scored by counting the number of their contacting-neighboring cells. The number in a green circle represents the score. The box plots show the distribution of the number of intercellular contacts among the outermost migrating cells in each line. Biological replicates: control, 15 inductions (KhES1, 3; WD39, 3; 201B7, 5; WA29, 4); CH1, 7 inductions (CH1#20, 3; CH1#25, 4); CH2, 12 inductions (CH2#1, 4; CH2#16, 3; CH2#19, 5). Number of cells scored: control, 3707 cells (KhES1, 1017 cells; WD39, 1197 cells; 201B7, 657 cells; WA29, 836 cells); CH1, 3600 cells (CH1#20, 1989 cells; CH1#25, 1611 cells); CH2, 3213 cells (CH2#1, 738 cells; CH2#16, 1791 cells; CH2#19, 684 cells). n = 0; **p<0.01 (Dunnett’s multiple comparisons test; Cohen’s d 2.67 (control vs CH1), Cohen’s d 1.93 [control vs CH2]). n = 1; n.s.; not significant, **p<0.01 (Dunn’s multiple comparisons test; Cohen’s d (control vs CH1) 1.02, Cohen’s d 1.71 [control vs CH2]. n > 1; **p<0.01 (Dunnett’s multiple comparisons test; Cohen’s d 2.88 (control vs CH1), Cohen’s d 1.54 [control vs CH2]). The following file is available for Figure 4, Figure 4—video 1 and 2, Figure 4—source data 1.

