. 2017 Nov 28;6:e27364. doi: 10.7554/eLife.27364

Figure 1. Global substrate specificity profiling of the iP and cP with Multiplex Substrate Profiling by Mass Spectrometry (MSP-MS) reveals shared and differential substrate specificity features.

(A) iceLogo representations of iP and cP substrate specificity (P4–P4ʹ) at the 480 min assay time point (p≤0.05 for non-grayed residues (Colaert et al., 2009); ‘n’ is norleucine). (B) Quantification of the total shared and non-overlapping iP- and cP-derived cleavages in the peptide library at the 480 min assay time point. Venn diagrams for additional assay time points are provided in Figure 1—figure supplement 1, demonstrating a time-dependent increase in cleavage overlap. (C) Heat map representation of iP and cP specificity differences using Z-scores (Colaert et al., 2009) calculated for the P4-P4ʹ positions. Differences in P1 specificity are highlighted. Heat maps for additional time points are provided in Figure 1—figure supplement 3. MSP-MS revealed that the iP has an increased preference for certain bulky, hydrophobic amino acid residues at the P1 position, whereas the cP has an increased preference for smaller and polar amino acid residues at the P1 position. A qualitative comparison of the P1 specificity differences identified using the MSP-MS library with those reported in Toes et al., 2001 and Mishto et al., 2014 is provided in Figure 1—figure supplement 4. Two biological replicates were assayed for each proteasome and only overlapping cleavages between replicates are reported. An analysis of biological (Figure 1—figure supplement 1) and technical (Supplementary file 1) reproducibility is provided.

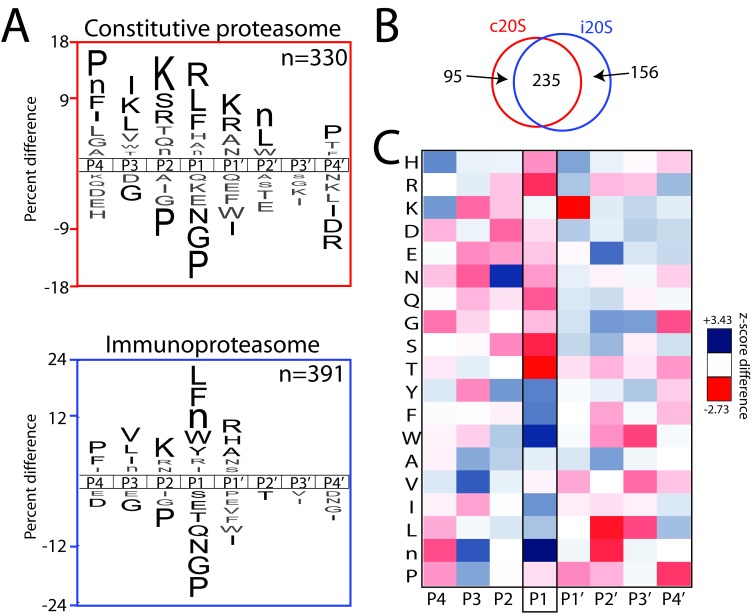
Figure 1—source data 1. The following are contained in a supplementary file for the MSP-MS assay: a sample key; the sequences of the peptide library in FASTA format; a full mass spectrometry peptide report; processed cleavage data showing spectral counts for each octapeptide (P4–P4ʹ) and the associated cleavage within the parental peptide; processed cleavage data (indicated as ‘negative’) with cleavages also appearing in the no-enzyme control (NEC) highlighted; all octapeptides (P4–P4ʹ) to be used as the background dataset in iceLogo; ‘positive’ octapeptide (P4–P4ʹ) cleavages with the ‘negative’ cleavage data removed; ‘accumulative’ octapeptide (P4–P4ʹ) cleavages at each assay time point for the proteasome biological replicates; a comparison of cleavages common between biological replicates; and heat maps based on Z-scores showing the specificity at each assay time point.
DOI: 10.7554/eLife.27364.007

Figure 1.

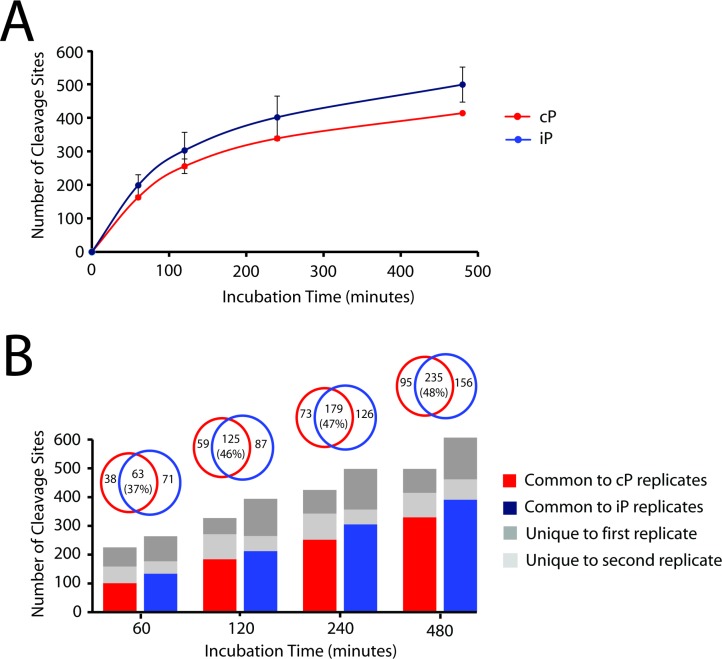
Figure 1—figure supplement 1. Comparison of iP- and cP-derived peptide cleavage products across all time points in the MSP-MS assay.

Figure 1—figure supplement 1.

(A) Progress curves for the iP and cP are shown demonstrating the kinetics of peptide cleavage during the MSP-MS assay time course. (B) Quantification of shared and non-overlapping cleavages is provided between two biological replicates of each proteasome (bar graph). Further comparison of iP and cP cleavage overlap is shown using only cleavages observed in both biological replicates (Venn diagrams). This analysis revealed that the iP and cP display a time-dependent increase in the number of shared cleavages.
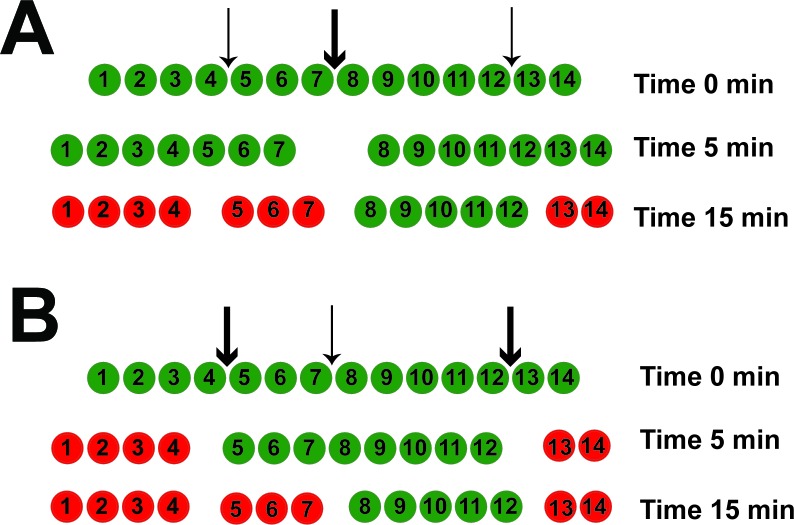
Figure 1—figure supplement 2. The MSP-MS assay detects the most dominant peptide cleavage events.

Figure 1—figure supplement 2.

These cleavage events are those that tend to occur initially and produce peptides of appropriate size (in m/z). For a given protease, the assay is capable of detecting up to approximately 20% of the total peptide bonds that can be cleaved in the library, which is similar to the maximum cleavage-site usage observed for each proteasome (Figure 1—figure supplement 1). In this illustrated example, green peptides are detected, whereas red peptides cannot be detected. The cP (A) and iP (B) cleave one of the 14-mer peptides at three positions, between residues 4–5, 7–8, and 12–13. If cleavage at the 7–8 position (thick arrow) by the cP is much faster than the 4–5 and 12–13 cleavages (thin arrows), then the 4–5 cleavage product is not detected. However, for the iP, if the 4–5 and 12–13 cleavages are much faster than the 7–8 cleavage, then all three sites can be detected, and the 4–5 cleavage site would be reported as unique to the iP.
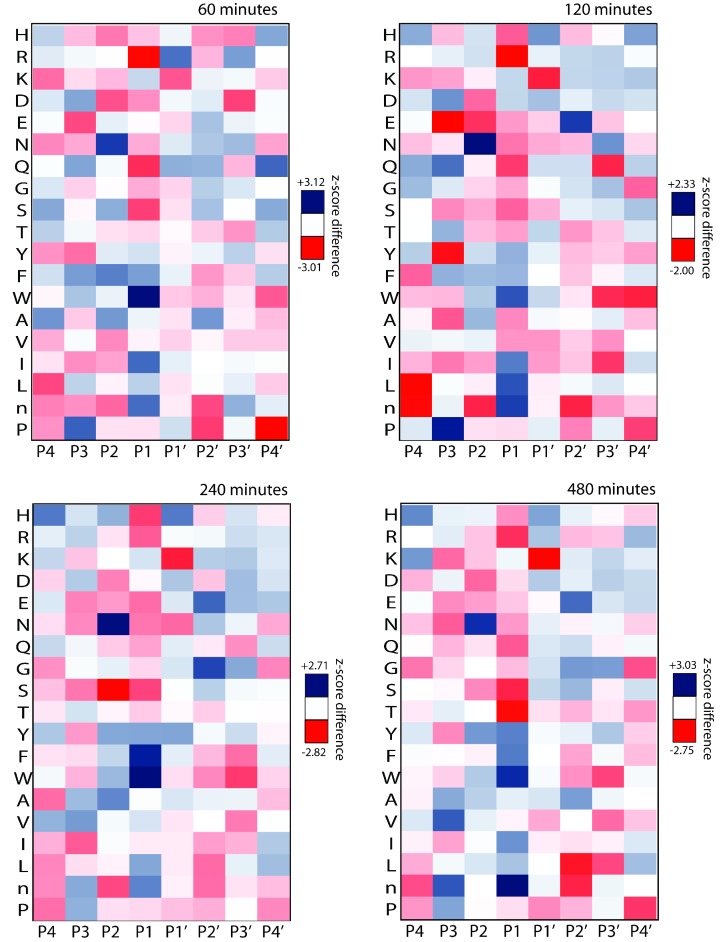
Figure 1—figure supplement 3. Heat maps for the iP and cP across multiple MSP-MS assay time points demonstrating shared and differential specificity features at the P4 to P4ʹ positions.

Figure 1—figure supplement 3.

The heat map from the 480 min assay time point has been repeated from Figure 1 for clarity.
Figure 1—figure supplement 4. Qualitative comparison of the major differences in human iP and cP P1 specificity preferences identified using the MSP-MS library compared to those reported in previous profiling studies.

Figure 1—figure supplement 4.

Toes et al used a model protein substrate (enolase-1) for proteasome cleavage, (Toes et al., 2001) whereas Mishto et al used a set of synthetic peptides corresponding to the sequences gp10035-57, gp100201-230, and pp8916-40 (Mishto et al., 2014).