. 2017 Nov 28;6:e27364. doi: 10.7554/eLife.27364

Figure 4. Differential substrate specificity of the iP alters MHC I peptide cleavage and is likely due to neutral evolution from the ancestral cP.

(A) Label-free quantitation of relative iP and cP cleavage rates against a library of synthetic peptides derived from sequences flanking sites of MHC I peptide processing (Bassani-Sternberg et al., 2015). Residues corresponding to the C-terminal portion of a given MHC I peptide are at positions 1–7 in the peptide library, whereas residues corresponding to the subsequent parent protein sequence are at positions 8–14. Average relative cleavage rates (log2) are provided for iP and cP substrates between positions 7 and 8 (P1/P1ʹ) for all peptides in the library that underwent cleavage at this site and for which quantification in all replicates was possible (n = 4). Two-fold differences in relative cleavage rate (log2 = 1) are indicated with a dashed line. Non-grayed bars represent statistically significant (q < 0.05) differences in selectivity as determined using a Student’s t-test (see Statistical methods). (B) Example kinetic traces from the MHC I peptide library time course showing cleavages following hydrophobic residues that have either high selectivity or no significant selectivity for the iP. Mean peak areas are reported with error bars representing the standard deviation (n = 4). (C) Evolutionary selection of residues in the β5 and LMP7 subunits across species that contain both proteasome isoforms. The β5 subunit has undergone more significant non-neutral evolution (residues are colored in orange) compared to the LMP7 subunit. Differences in evolutionary selection may account for the divergence in LMP7 and β5 cleavage specificity. Sequence alignments are provided in Figure 4—figure supplement 2.

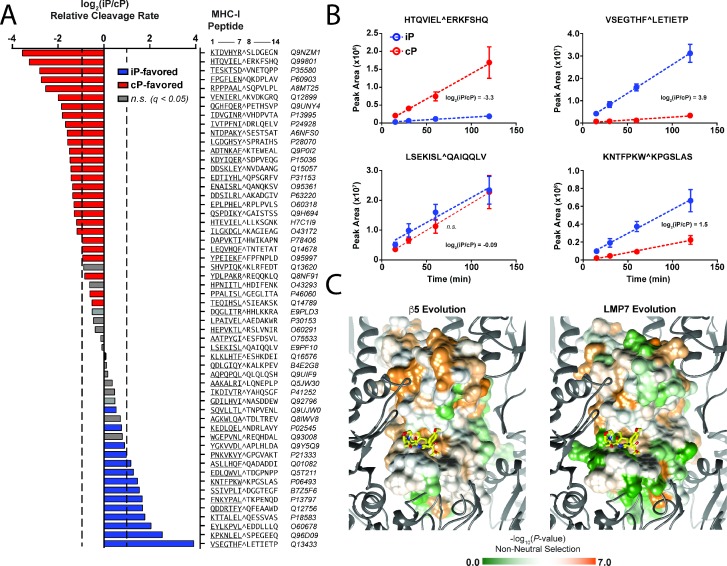
Figure 4—source data 1. The following are contained in a supplementary file for the MHC cleavage assay: a sample key; the sequences of the peptide library in FASTA format; and a full mass spectrometry peptide report.
DOI: 10.7554/eLife.27364.018

Figure 4.

Figure 4—figure supplement 1. Prediction of MHC I peptide cleavage by the iP and cP.

Figure 4—figure supplement 1.

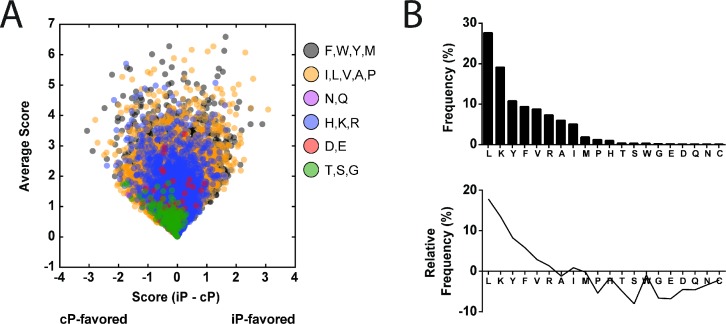
(A) Scoring of the MHC I peptidome (Bassani-Sternberg et al., 2015) (n = 22,598) based on the relative favorability for cleavage by the iP or cP. Scores were derived from the P4-P1 cleavage preferences of each proteasome as determined in the MSP-MS assay. MHC I peptides are colored according to their C-terminal residue (cysteine was omitted because it is absent in the MSP-MS library; norleucine was incorporated into the MSP-MS library instead of methionine and was used for scoring methionine residues). (B, top) Frequency of the C-terminal residues in the MHC I peptidome. (B, bottom) Relative frequency of the C-terminal residues following subtraction of the frequencies of the corresponding amino acids in the human proteome (Liu et al., 2010b).
Figure 4—figure supplement 2. Protein sequence alignment for (A) β5 and (B) LMP7 in diverse species containing both proteasomes.

Figure 4—figure supplement 2.

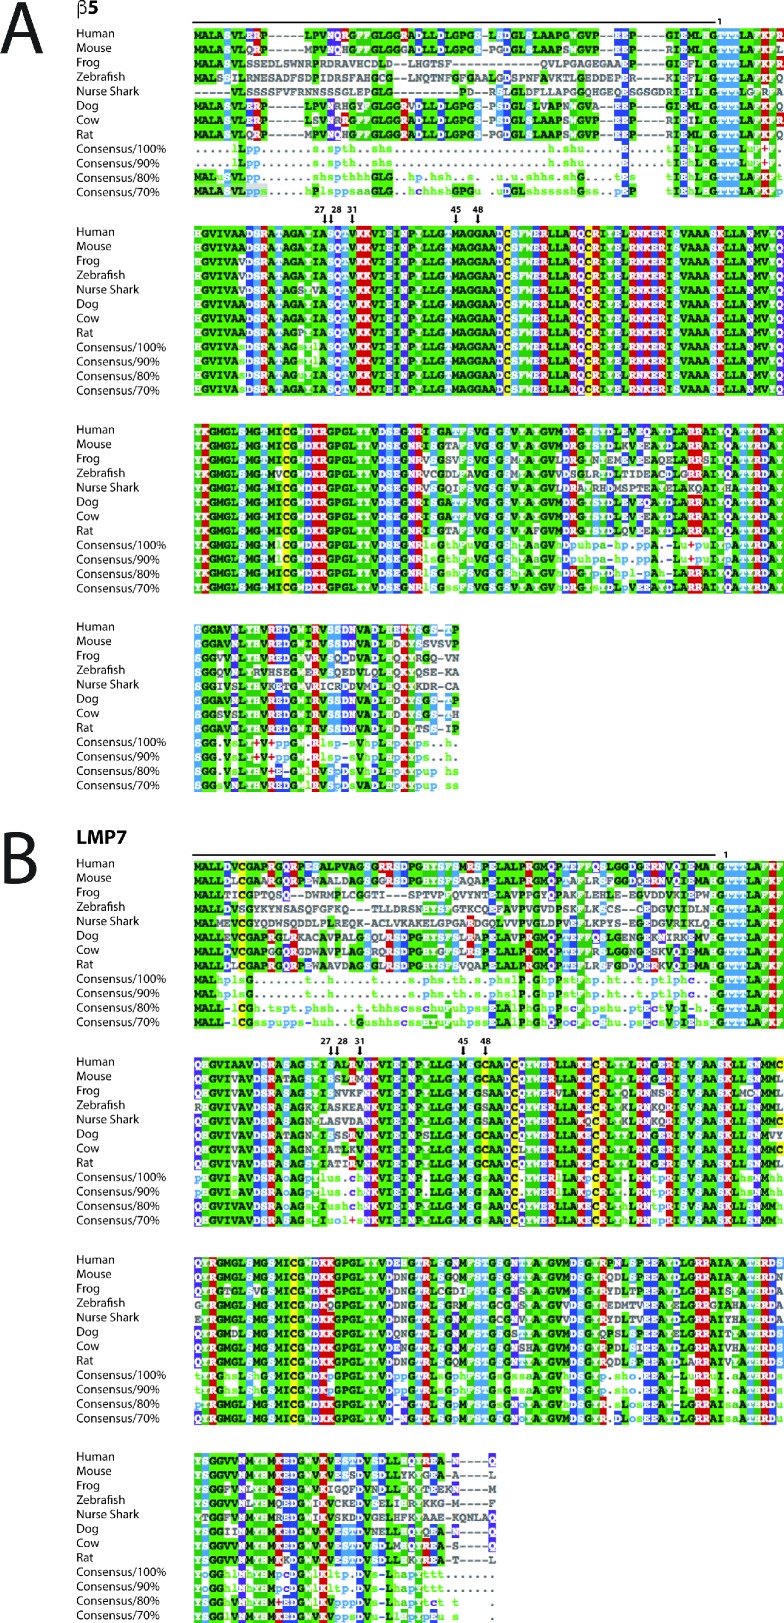
(Sutoh et al., 2012) UniProt identification numbers are respectively as follows for β5 and LMP7: P28074 and P28062, Homo sapiens (human); O55234 and P28063, Mus musculus (mouse); P28075 and P28064, Rattus norvegicus (rat); Q32KL2 and Q3T112, Bos taurus (bovine); E2R3R2 and Q5W416, Canis familiaris (dog); F6WGD3 and A8E5T8, Xenopus tropicalis (western clawed frog); A8E5G8 and O57330, Danio rerio (zebrafish); Q90572 and Q90571, Ginglymostoma cirratum (nurse shark). Key residues described in the text are labeled for comparison.