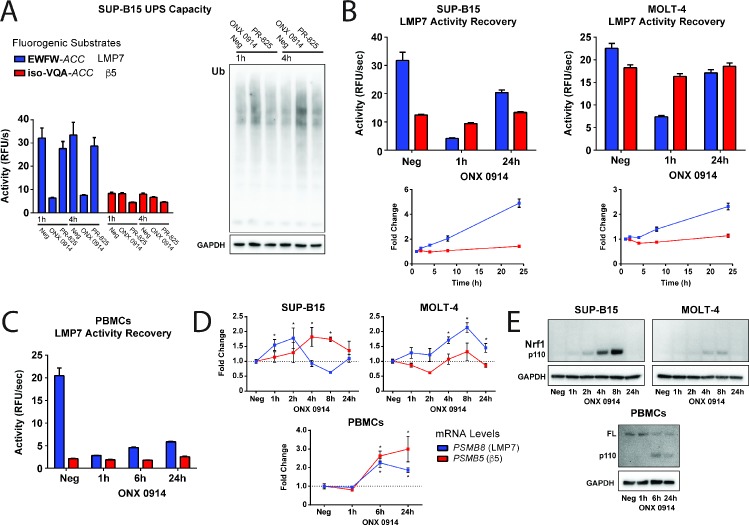
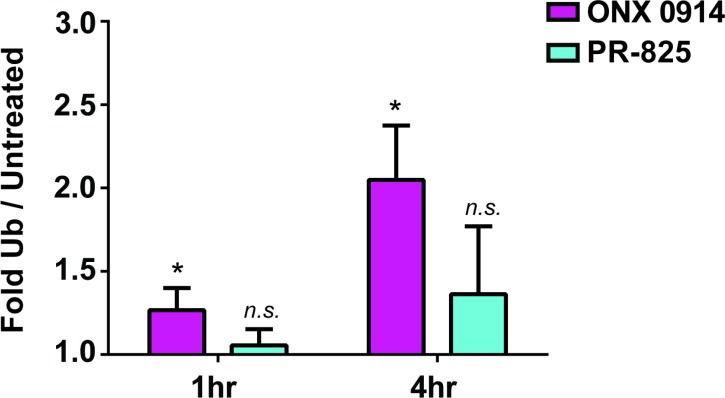
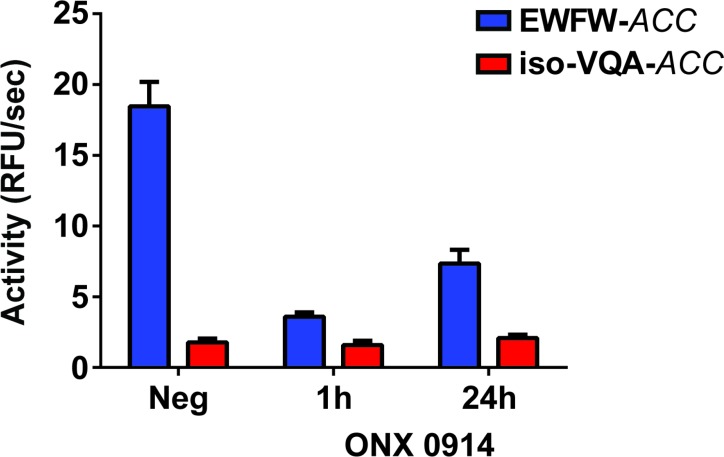
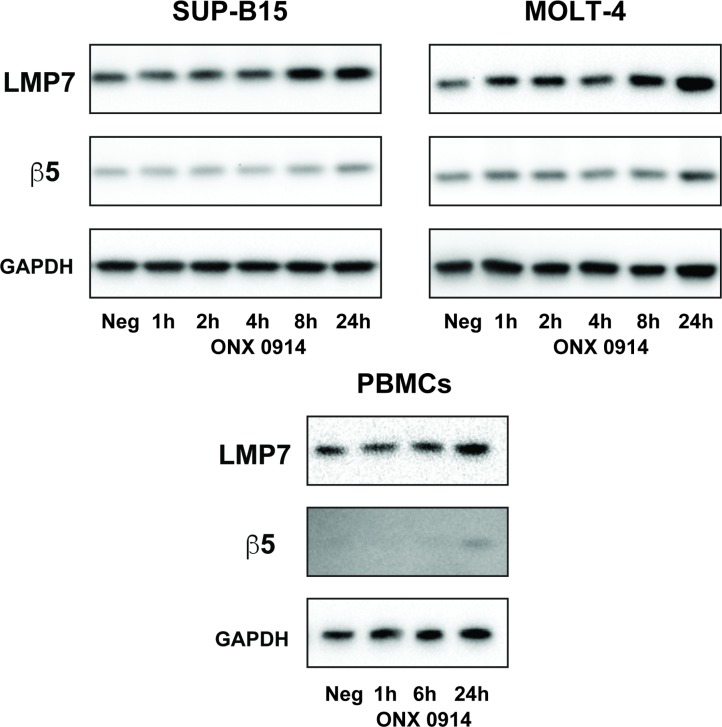
Figure 5. iP activity makes a significant contribution to UPS capacity and undergoes selective and coordinated recovery from inhibition.
(A) Ubiquitin western blot and matched activity assay for the SUP-B15 cell line (with approximately 80:20 LMP7: β5 activity) showing a substantial increase in global ubiquitination levels upon one-hour pulse treatment with ONX 0914. A significant increase in ubiquitination was not observed with PR-825 treatment, suggesting that LMP7 is a more dominant contributor to UPS capacity in this cell line in accordance with the proportionally higher LMP7 activity level. Selective recovery of LMP7 activity over 24 hr in the (B) SUP-B15 and MOLT-4 cell lines and in (C) primary PBMCs from a healthy donor (see also Figure 5—figure supplement 2) upon one-hour pulse treatment with ONX 0914. The SUP-B15 and MOLT-4 lower panels show the fold change in LMP7 and β5 activity levels normalized to the one-hour time point. For all activity assays, mean activity is reported with error bars representing the standard deviation from n = 3–6 replicates. (D) Corresponding qRT-PCR analysis of PSMB8 (LMP7) and PSMB5 (β5) mRNA dynamics in the cell lines and PBMCs following ONX 0914 treatment. Mean expression levels are reported with normalization to GAPDH. Statistically significant differences are indicated (*p≤0.05) as determined using a Student’s t-test with error bars representing the SEM from n = 3 replicates. (E) Corresponding western blots demonstrating accumulation of processed Nrf1 (p110) in RIPA lysates from the cell lines and PBMCs following ONX 0914 treatment. Full-length (FL) Nrf1 was observed in the PBMC lysates. .


