. 2017 Oct 26;6:e28383. doi: 10.7554/eLife.28383

Figure 1. Comparison of seven distinct motifs bound by human PRDM9 (B allele).

(a) Seven motif logos produced by our algorithm (applied to the top 5,000 PRDM9 binding peaks ranked by enrichment, after filtering out repeat-masked sequences) were aligned to each other and to an in silico binding prediction (Myers et al., 2010; Persikov et al., 2009; Persikov and Singh, 2014, maximizing alignment of the most information-rich bases. The position of the published hotspot 13-mer is indicated by the gray box overlapping the in silico motif (Myers et al., 2008). On the right is the percentage of the top 1,000 peaks (ranked by enrichment without further filtering) containing each motif type. Zinc-finger residues at 3 DNA-contacting positions (labeled −1, 3, 6) are illustrated below each ZF position, classified by polarity, charge, and presence of aromatic side chains. ZFs 5 and 6 lack positively charged amino acids and contain aromatic tryptophan residues, and they coincide with a variably spaced motif region (indicated by vertical dotted lines). Motif 4 is truncated here. (b) H3K4me3 ChIP-seq data from PRDM9-transfected HEK293T cells (this study) and H3K4me3/DMC1 data from testes (Pratto et al., 2014) were force-called to provide a p-value for enrichment of each sample in a 1 kb window centered on each PRDM9 peak (filtered to remove coverage outliers and those overlapping H3K4me3 peaks in untransfected cells). PRDM9 enrichment values are unitless (equal to the estimated signal divided by background, minus 1 and set to 0 if negative, at the base with the smallest p-value within each peak). Peaks were split into deciles according to their PRDM9 enrichment values, and the proportion of peaks with a force-called H3K4me3 or DMC1 p-value <0.05 is plotted within each decile. (c) Peaks were stratified into quartiles based on increasing PRDM9 enrichment (light green to dark green) after filtering out promoters. Mean recombination rates (from the HapMap LD-based recombination map, Frazer et al., 2007) at each base in the 20 kb region centered on each bound motif are plotted for each quartile, with smoothing (ksmooth, bandwidth 25). (d) Left plot: Peak enrichment quartiles (filtered to remove promoters as in c) were separated by motif type (Motifs 2, 3, and 5 were combined due to low abundance), and the mean HapMap CEU recombination rate overlapping peak centers was plotted against median PRDM9 enrichment in each quartile, with lines of best fit added for Motif 7 (pink) versus all other motifs. Right plot: Fold enrichment of each motif in AB-only DMC1 peaks versus AA-only DMC1 peaks (Pratto et al., 2014). Error bars indicate two standard errors of the mean (left plot) or 95% bootstrap confidence intervals (right plot).

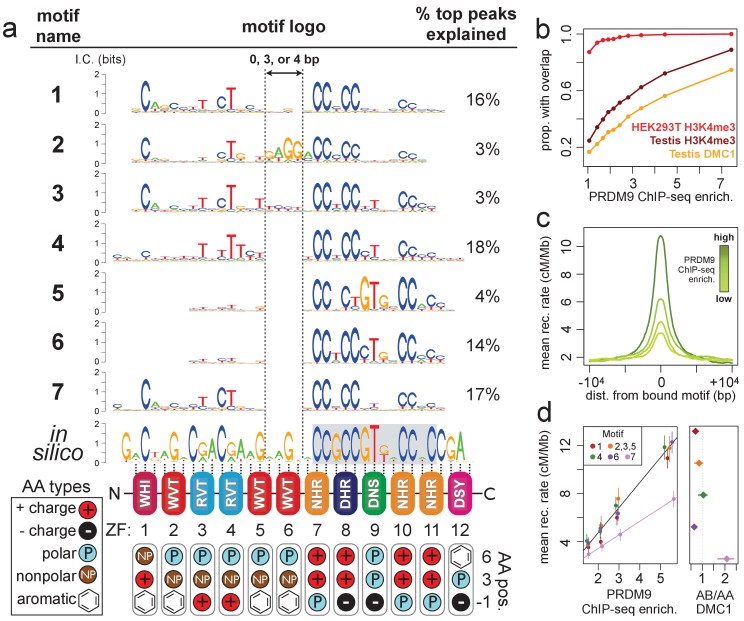
Figure 1—source data 1. List of all ChIP-seq samples.
DOI: 10.7554/eLife.28383.008
Figure 1—source data 2. PWMs for all motifs, in MEME format.
DOI: 10.7554/eLife.28383.009

Figure 1.

Figure 1—figure supplement 1. DMC1, H3K4me3, and H3K36me3 signals surrounding human PRDM9 peaks.

Figure 1—figure supplement 1.

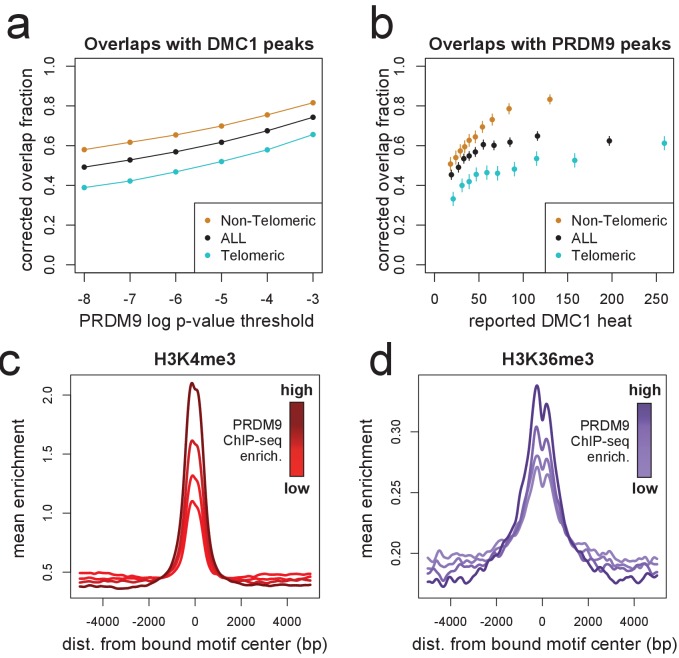
(a) A comparison our autosomal PRDM9 peaks, called at various p-value thresholds ranging from 10−8 to 10−3 (minimum peak separation 250 bp), to a set of published DSB hotspots corresponding to the human A allele (from a set of 18,343 ‘Intersect’ DMC1 hotspots found in multiple individuals, filtered to remove hotspots wider than 3 kb; Pratto et al., 2014). Hotspots were further split into subsets occurring within 15 Mb of a telomere (turquoise) or not (orange). ‘Overlap’ requires a PRDM9 peak center to fall within a reported DMC1 hotspot interval, and overlap fractions were corrected downward to account for chance overlaps (see Materials and methods). (b) DMC1 hotspots were split into decile bins by reported DMC1 heat, and the proportion of hotspots in each bin overlapping one or more of our PRDM9 peaks is indicated (error bars represent two standard errors of the proportion). (c) Profile plot showing the mean H3K4me3 enrichment (measured in HEK293T cells transfected with human PRDM9) at bound human motifs conditioned not to have any H3K4me3 enrichment measured in untransfected cells, and split into quartiles of increasing PRDM9 enrichment (smoothing: ksmooth, bandwidth 200) (d) Profile plot showing the mean H3K36me3 enrichment (measured in HEK293T cells transfected with human PRDM9) at bound human motifs conditioned not to have any H3K36me3 enrichment measured in untransfected cells, and split into quartiles of increasing PRDM9 enrichment. NB: absolute enrichment values cannot be compared across samples. (smoothing: ksmooth, bandwidth 25) .
Figure 1—figure supplement 2. Comparison of PRDM9 and H3K4me3/DMC1 enrichment values.

Figure 1—figure supplement 2.

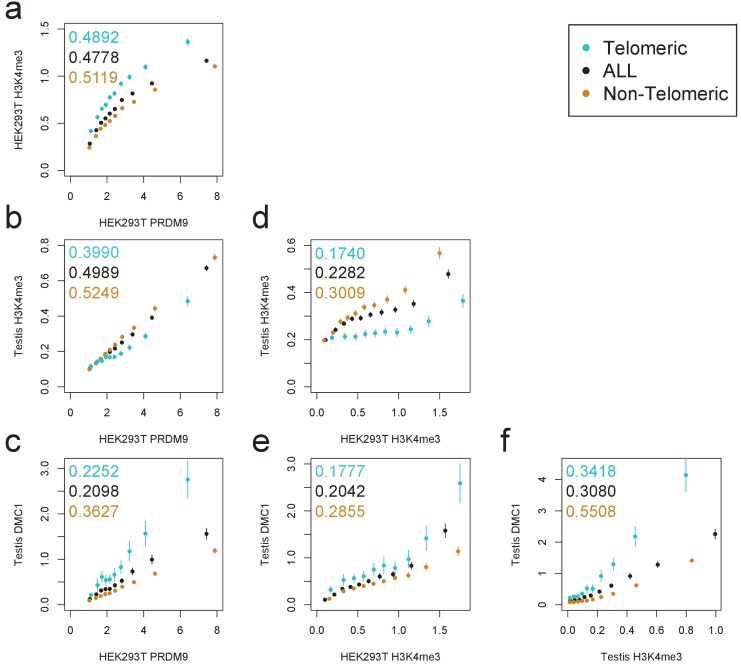
H3K4me3 ChIP-seq data from transfected HEK293T cells (this study) and H3K4me3/DMC1 data from testes (Pratto et al., 2014) were force-called in a 1 kb window centered on each PRDM9 binding peak center (p<10−6, minimum peak separation 1000 bp) to provide an enrichment value for each H3K4me3/DMC1 sample at each PRDM9 peak. Peaks were further split into subsets occurring within 15 Mb of a telomere (turquoise) or not (orange). Pairwise comparisons plot the mean force-called enrichment value of each sample (y axis) in each enrichment decile bin of each other sample (x axis). Points are positioned at the median value of each decile and error bars represent two standard errors of the mean. Raw Pearson correlation values are printed on each plot. All comparisons show a significant positive correlation (p<2×10⁻¹⁶). Peak windows with fewer than five input reads from cells or testes were filtered out, to improve enrichment estimates, and windows with excessive genomic coverage (in the top 0.1%ile) or IP coverage (>500 combined fragments) were removed to avoid outliers due to mapping errors. PRDM9 peaks overlapping H3K4me3 peaks from untransfected cells were removed, leaving 37,188 peaks passing all filters. Interestingly, we observe an enrichment of H3K4me3 in telomeric peaks in our HEK293T cells but not in testes. .
Figure 1—figure supplement 3. All motifs found in human PRDM9 peaks.

Figure 1—figure supplement 3.

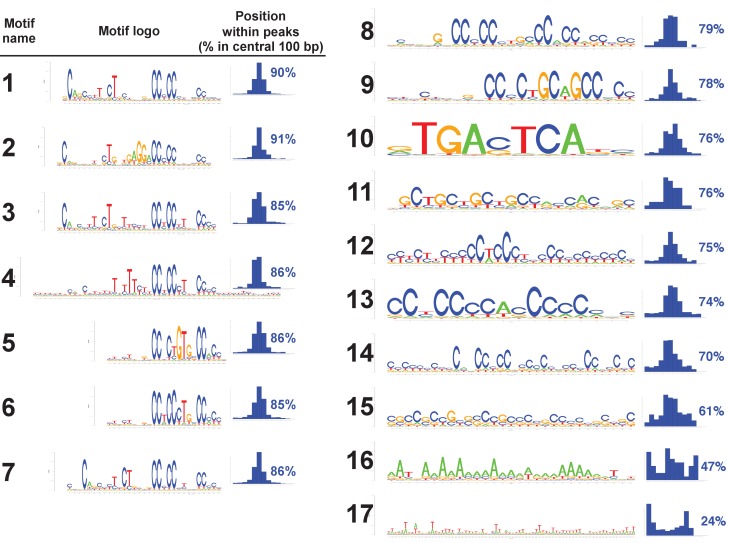
All 17 motif logos returned by our motif-finding algorithm are listed, along with histograms indicating their positions within the central 300 bp of our human PRDM9 peaks, as a measure of how centrally enriched they are (and therefore likely to represent true binding targets). Only the seven motifs for which greater than 85% of occurrences within peaks are within 100 bp of the peak center were retained for downstream analyses. The remaining, less centrally enriched, motifs are either degenerate (as seen in mice containing the human allele: (Davies et al., 2016) or may arise as a consequence of PRDM9 binding to promoter regions (this would explain Motif 10, which is a near identical match to the binding motif for the transcription factor AP1).
Figure 1—figure supplement 4. Motif 7 represents a binding mode favored by the B allele.

Figure 1—figure supplement 4.

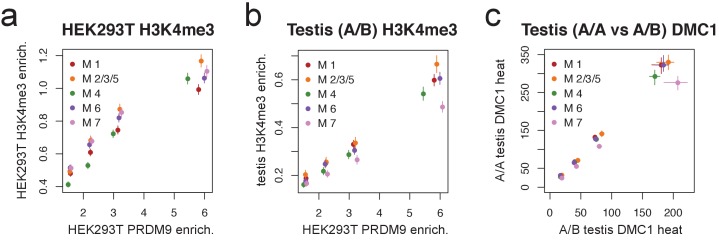
(a) Peak enrichment quartiles (filtered to remove promoters) were separated by motif type (Motifs 2, 3, and 5 were combined due to low abundance), and mean force-called H3K4me3 enrichment was plotted against median PRDM9 enrichment in each quartile. Error bars indicate two standard errors of the mean. This shows that the lower recombination rates for Motif 7 do not result from lower histone methylation activity of PRDM9 at those sites. (b) Peak enrichment quartiles as in a, but with force-called testis H3K4me3 enrichment values from (Pratto et al., 2014) in an individual with an A/B genotype. Motif 7 shows lower testis H3K4me3 enrichment for each level of PRDM9 binding, consistent with it being bound less efficiently by the A allele. Error bars indicate two standard errors of the mean. (c) At DMC1 hotspots found in both A/A and A/B individuals (from Pratto et al., 2014), a q-q plot of reported DMC1 heats for each motif type (quantiles 0.125,0.375,0.625,0.875). Motif 7 peaks are relatively hotter in the A/B samples than in the A/A samples. Error bars represent 95% bootstrap confidence intervals.