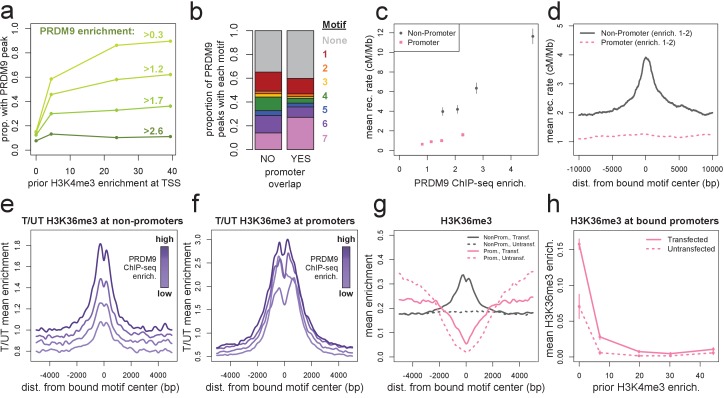
Figure 2. Human PRDM9 can bind promoters, though recombination is suppressed.
(a) The chance-corrected proportion of protein-coding genes that have a PRDM9 peak center occurring within 500 bp of the TSS, stratified by different PRDM9 enrichment value thresholds (shades of green, with thresholds listed), in each quartile of force-called H3K4me3 enrichment surrounding the TSS in untransfected cells. The power to detect weaker binding events increases at more active promoters (as measured by H3K4me3), though strong PRDM9 binding events appear at roughly 10% of all promoters regardless of activity. (b) Barplot illustrating the proportion of promoter or non-promoter PRDM9 peaks assigned to each of the 7 motifs (or no motif, in gray). Motif 7 appears 2-fold enriched in promoter peaks. (c) Mean HapMap CEU recombination rates are reported for promoter (pink squares) and non-promoter (gray circles) human PRDM9 peaks split into quartiles of PRDM9 enrichment (filtered not to overlap repeats or occur within 15 Mb of a telomere; error bars represent two standard errors of the mean). Both median enrichment values and recombination rates are greater for non-promoter peaks, even in overlapping ranges of PRDM9 enrichment. (d) Mean recombination rate in 20 kb windows centered on bound motifs, for promoter (pink) and non-promoter (gray) peaks further filtered only to include peaks with PRDM9 enrichment values between 1 and 2 (smoothing: ksmooth bandwidth 200). (e) Mean H3K36me3 enrichment in transfected cells divided by mean H3K36me3 enrichment in untransfected cells at 36,000 non-promoter PRDM9 binding sites split into quartiles of PRDM9 enrichment (shades of purple). (f) same as e but for 10,000 promoter PRDM9 binding sites split into quartiles of PRDM9 enrichment. (g) The absolute mean enrichment values used to generate plots e and f, split into transfected (solid) and untransfected (dotted) samples at promoter (pink) and non-promoter (gray) PRDM9 binding sites in the top quartile of PRDM9 enrichment. There is a depletion of H3K36me3 coverage surrounding promoters in untransfected cells, but the magnitude of this depletion decreases in transfected cells. (h) At 4,000 protein-coding genes with a strong PRDM9 binding peak within 500 bp of the TSS (PRDM9 enrichment >2 and <10), we show the relationship between force-called H3K4me3 enrichment and force-called H3K36me3 enrichment in the 1 kb surrounding each TSS, for both transfected and untransfected cells (solid and dotted lines). Error bars indicate two standard errors of the mean H3K36me3 enrichment within each quintile of H3K4me3 enrichment. H3K36me3 enrichment increases in transfected cells at all strongly bound promoters, but this effect diminishes almost to 0 as promoter activity increases (which forces H3K36me3 close to 0 in all cells). This effect cannot be accounted for by the modest decrease in PRDM9 enrichment at more active promoters (mean PRDM9 enrichment decreases from 4.3 in the first H3K4me3 quintile to 3.1 in the fifth quintile).

