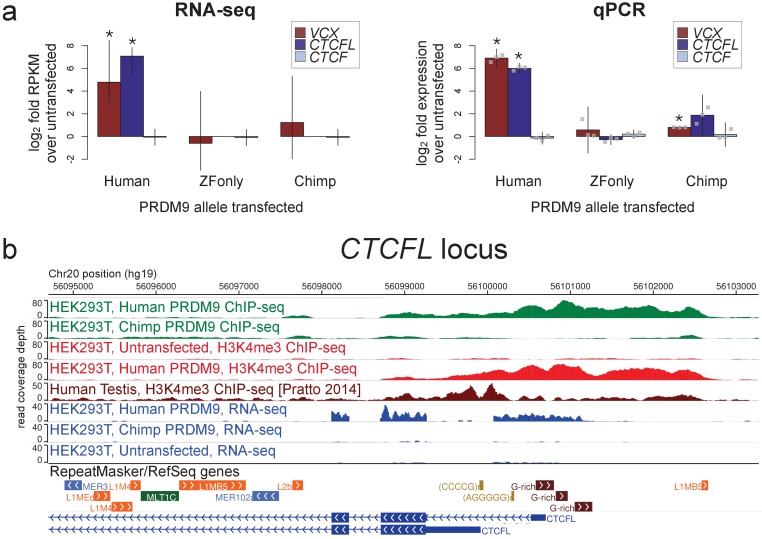
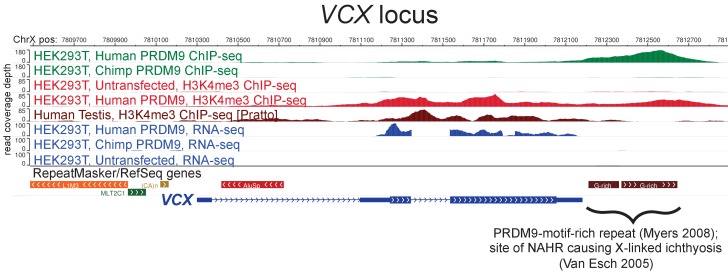
Figure 3. Spermatogenesis-specific genes VCX and CTCFL are activated by human PRDM9 in HEK293T cells.
(a) left: Bar plots showing the log2 fold change relative to untransfected HEK293T cells in computed FPKM values (fragments per kilobase of transcript per million mapped RNA-seq reads) for HEK293T cells transfected with the human allele, the chimp allele, or a construct containing only the human Zinc-Finger domain, for CTCFL and VCX, with CTCF as a negative control. Error bars conservatively represent maximum ranges of the ratios given confidence intervals for FPKM values computed by cufflinks (Trapnell et al., 2012). Asterisks indicate significant differential gene expression, as reported by CuffDiff (p<0.0001). right: qPCR validation results for the same genes from 3 independent biological replicates. Y-axis values are log ratios of C values for each gene relative to the untransfected sample (normalized to the TBP housekeeping gene; see Materials and methods). Error bars represent 95% confidence intervals from 3 biological replicates (t distribution; gray points represent individual replicate values), and asterisks indicate p<0.001 (one-tailed t test). (b) A browser screenshot (Zhou et al., 2011) from Chr20 near the promoter region of CTCFL with custom tracks indicating ChIP-seq and RNA-seq raw read coverage data. Human PRDM9, but not chimp PRDM9, (green) binds a G-rich repeat near the TSS, adding an H3K4me3 mark (light red) where none is present in untransfected cells. RNA-seq coverage (blue) spikes in the coding regions in transfected cells, while it is nearly flat in untransfected cells or chimp-transfected cells. Testis H3K4me3 coverage (dark red, from Pratto et al., 2014) peaks at a slightly different locus, corresponding to an alternative TSS.


