. 2017 Oct 26;6:e28383. doi: 10.7554/eLife.28383

Figure 4. Influences on recombination in cis downstream of PRDM9 binding.

(a) Analysis of THE1B repeats shows the positions along the THE1B consensus (bottom, gray) of motifs influencing PRDM9 binding (top row), motifs influencing recombination hotspot occurrence at bound sites (middle two rows), and motifs influencing H3K4me3/H3K9me3 in testes and somatic cells (bottom row). Rectangle widths show motif size, and heights show log-odds-ratio or effect size (two standard errors delineated). Rectangles below the lines have negative effects. Motifs associated with PRDM9 binding are in red; others in blue. Binding motifs for labeled proteins are at the plot base. (b) Left plot shows LD-based recombination rates around the centers of THE1B repeats containing different approximate matches to the PRDM9 binding motif CCTCCC[CT]AGCCA[CT] (colors) and the motif ATCCATG (lines dotted if present). Right plot is the same but shows mean H3K4me3 in testes (from Pratto et al., 2014). ATCCATG presence reduces recombination and increases H3K4me3. (c) Impact of ATCCATG presence (+) or absence (-) on normalized enrichment values around the centers of THE1B repeats, of H3K4me3 and H3K9me3 in different cells (labeled pairs of color bars, normalized to equal 1 at edges). H3K9me3 shows the strongest signal increase. (d) Predicted non-PRDM9 H3K9me3/H3K4me3 versus probability DMC1-based or LD-based hotspots occur at PRDM9-bound sites. For the x-axis repeats were binned according to an additive DNA-based score, using the bottom row of part A and the combination of motifs they contained. (e) Estimated impact on whether a hotspot occurs of co-binding by individual KRAB-ZNF proteins (labels; Imbeault et al., 2017) near a PRDM9 binding peak (genome-wide, not only within THE1B repeats, after filtering out promoter regions). For each KRAB-ZNF protein, a GLM was used to estimate the impact of KRAB-ZNF binding (binary regressor) on hotspot probability. We show the estimated log2-odds, with 95% CIs. Colors indicate H3K9me3 enrichment increase at co-bound sites. Horizontal line shows the results for TRIM28. Features below the horizontal dotted line have a negative estimated impact on downstream recombination.

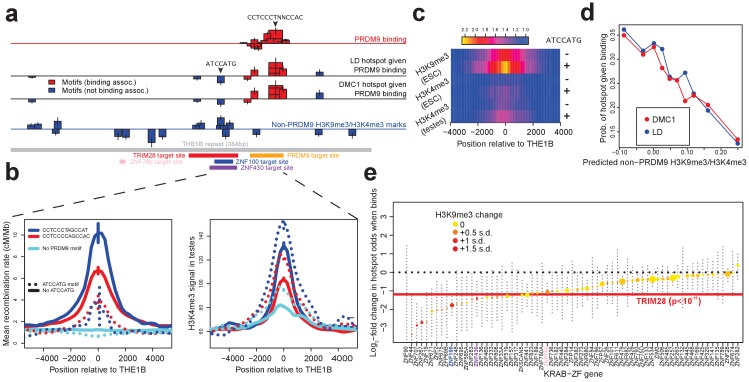
Figure 4—source data 1. Detailed information on all THE1B motifs.
DOI: 10.7554/eLife.28383.022

Figure 4.

Figure 4—figure supplement 1. Features associated with recombination outcomes given PRDM9 binding.

Figure 4—figure supplement 1.

(a) DMC1-based recombination rates around the centers of THE1B repeats containing different approximate matches to the PRDM9 binding motif CCTCCC[CT]AGCCA[CT] (colors) and the motif ATCCATG (lines dotted if absent). ATCCATG presence reduces recombination. Vertical lines: ±2 s.e. (b) For 18 motifs identified to influence H3K4me3 signal strength at THE1B repeats in testes (and H3K9me3 in other cell types, see d) but not PRDM9 (Appendix 2) we fit a joint generalized linear model of each motifs effect size on H3K4me3 in testes (x-axis). For the same set of motifs, we fit two joint generalized linear models to estimate each motif’s effect size on the probability a THE1B repeat overlaps respectively a DMC1 or LD-based hotspot, and average the estimated effect sizes, corresponding to an odds ratio for each motif (y-axis). Points are colored according to whether coefficients for the second linear models differ significantly from zero (legend). The strong negative correlation on the plot implies that motifs increasing H3K9me3/H3K4me3 associate with decreased recombination, and conversely. (c) Four panels correspond to two different histone modifications H3K9me3 and H3K4me3, in two distinct somatic embryonic stem cell types (E014 and E016) studied by ROADMAP (Kundaje et al., 2015) and labeled accordingly on the y-axis. In each panel the x-axis is as for b. Each y-axis gives estimated coefficients under a generalized linear model fitted in the same way as the x-axis (Appendix 2), predicting enrichment of that particular histone modification in a particular cell type in THE1B repeats by presence/absence of each motif. Points are colored according to whether coefficients for this linear model differ significantly from zero (legend). Note strong positive correlations (each plot is labeled with rank-based correlation and p-value of rank-based correlation test) of 0.86 to 0.93, slightly higher for H3K9me3 than H3K4me3 and showing larger coefficients. The same motifs are then associated with both H3K9me3 and H3K4me3 changes across cell types including the cells lacking PRDM9 expression.
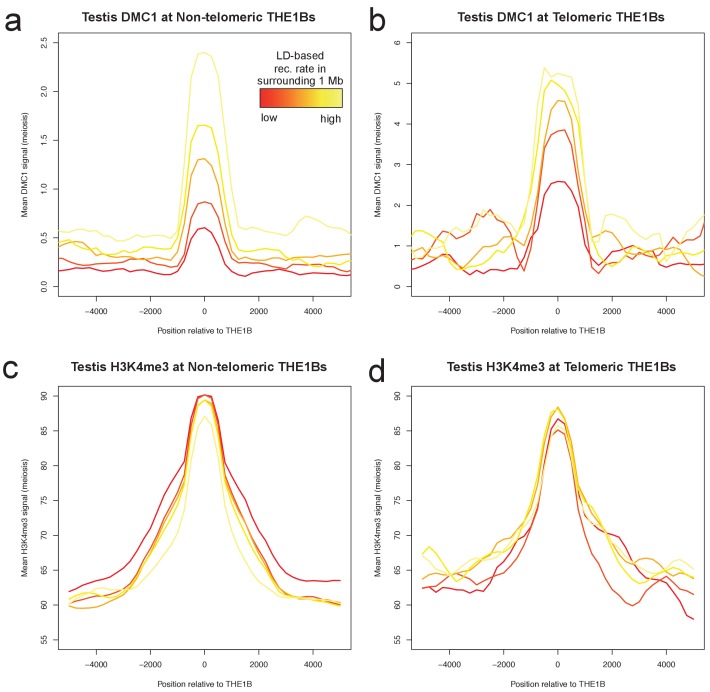
Figure 4—figure supplement 2. Large-scale recombination rate affects testis DMC1 but not H3K4me3.

Figure 4—figure supplement 2.

Profiles of mean DMC1 and H3K4me3 read coverage from human male testes (with a PRDM9 A/B genotype; Pratto et al., 2014) around all THE1B repeats, stratified into quantiles based on the pedigree-based recombination heat in the surrounding 1 Mb of DNA (Kong et al., 2002, excluding the surrounding 20 kb and the repeat itself, by color (red to yellow are increasing 20% quantiles). H3K4me3 shows no impact whatsoever from surrounding recombination rate, implying PRDM9 binding is completely unaffected (c,d). However DMC1 signal increases dramatically (a,b), implying that broad-scale recombination control at these repeats occurs completely independently of PRDM9 binding or local sequence. Note the y-axes are different for telomere and non-telomere DMC1 (a,b) but not H3K4me3 (c,d). Telomeric sites were defined as those occurring within 10 Mb of a telomere, and H3K4me3 values were capped at 500 to reduce outlier effects. .