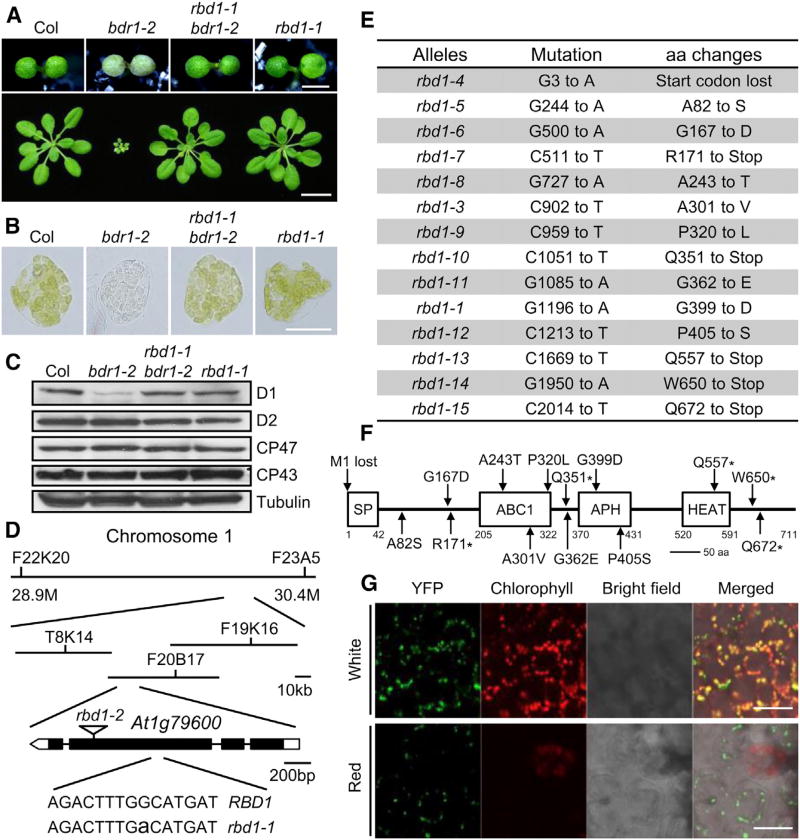
Figure 1. rbd1 is a Genetic Repressor of bdr1-2 and Subcellular Localization of RBD1.
(A) Upper panel. Phenotype of 7-day-old Col, bdr1-2, rbd1-1 bdr1-2, and rbd1-1 seedlings grown under continuous red light (50 µmol·m−2·s−1). Bars represent 1 mm. Lower panel. Morphology of Col, bdr1-2, rbd1-1 bdr1-2 and rbd1-1 plants on soil. The photograph shows soil-grown plants 2 weeks after planting. Bars represent 10 mm.
(B) Microscopic images representative of mesophyll cells separated from the first true leaves of Col, bdr1-2, rbd1-1 bdr1-2, and rbd1-1. Plants were grown under red light for 5 days and then transferred to continuous white light for 9 days. Bars represent 20 µm.
(C) Immunoblot analyses of the total proteins from the cotyledons of 7-day-old seedlings grown under continuous red light using anti-D1, -D2, -CP43, or -CP47 antibodies. An anti-tubulin immunoblot is shown below to indicate approximately equal loadings.
(D) Map-based cloning of RBD1 (At1g79600) and the mutation position of rbd1-1 and rbd1-2 (T-DNA insertion line, Salk_128696C).
(E) Mutations identified in the rbd1 alleles and the consequences of mutations to RBD1 protein. aa, amino acids.
(F) Protein structure of RBD1. SP, signal peptide; ABC1, Absence of bc1 complex; APH, amino-glycoside phosphotransferase; HEAT, Huntingtin, elongation factor 3 (EF3), protein phosphatase 2A (PP2A), and the yeast kinase TOR1; aa, amino acids. The positions of the amino acid affected in each rbd1 mutant are indicated.
(G) RBD1-YFP localization in cotyledons. From left panel to right panel: confocal YFP signals, chlorophyll autofluorescence signals, bright field image and merged image of bright field, chlorophyll autofluorescence, and YFP signals. Bars represent 20 µm.

