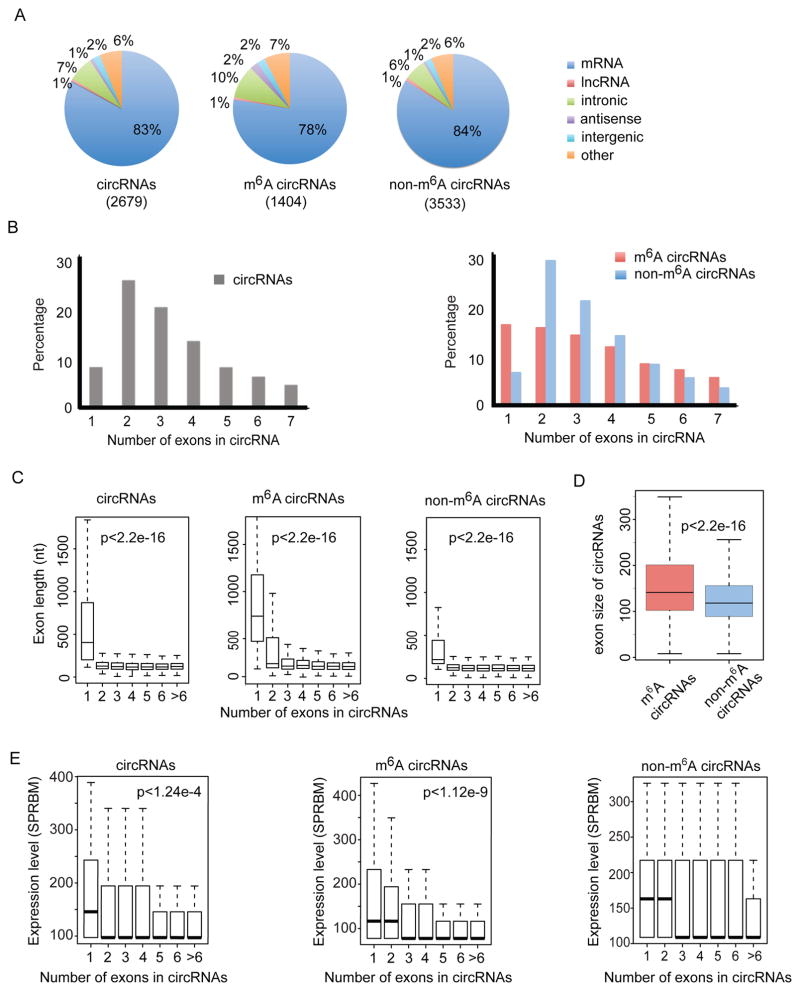
Figure 3. CircRNAs are frequently methylated in human embryonic stem cells.
(A) Genomic distribution of total circRNAs (input, left), m6A-circRNAs (eluate, center), and non-m6A-circRNAs (supernatant, right). The total number of circRNAs identified in each condition is shown in parenthesis. (B) The percentage of circRNAs (y-axis) was calculated based on the number of exons each circRNA spans (x-axis) for input circRNAs (left), m6A-circRNAs (red, right panel) and non-m6A-circRNAs (blue, right panel). The number of exons up to seven is displayed. (C) The distributions of exon length (y-axis) for input circRNAs (left), m6A-circRNAs (middle) and non-m6A-circRNAs (right) are plotted based on the number of exons spanned by each circRNA (x-axis). (D) Comparison of exon size of m6A-circRNAs and non-m6A-circRNAs. (E) Expression levels (y-axis) for input circRNAs, m6A-circRNAs, and non-m6A-circRNAs are plotted based on the number of exons spanned by each circRNA (x-axis). P values indicate that single exon circRNAs are more abundant than circRNAs composed of more than one exon.

