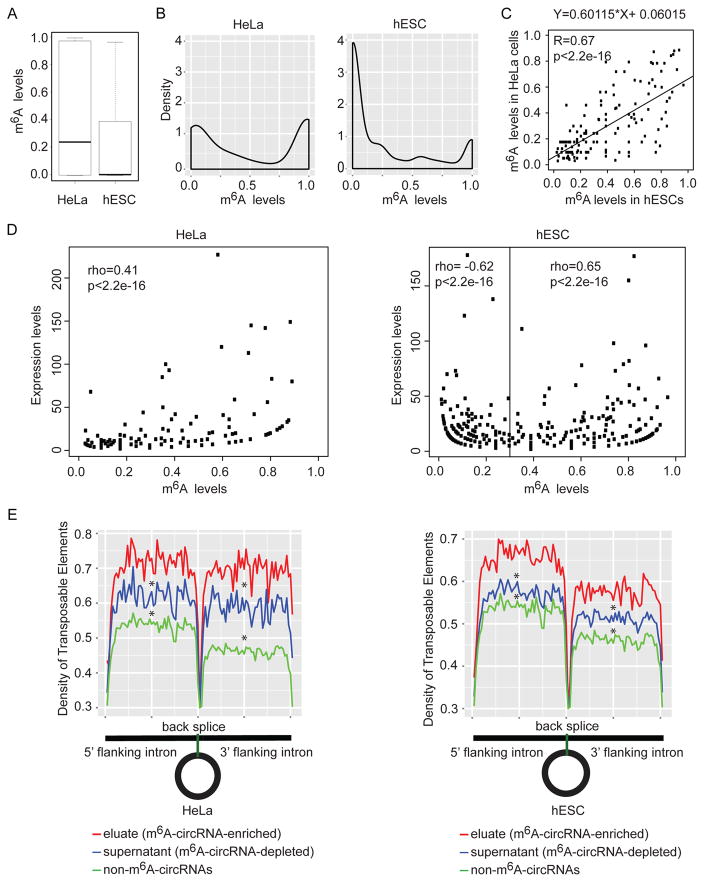
Figure 6. m6A levels.
(A) Comparison of m6A levels in circRNAs in HeLa cells and hESCs with at least 2 reads supporting the back splice junctions in eluate and supernatant data. (B) Density distributions of m6A levels in circRNAs using the same criteria as in (B). (C) Scatter plot showing the linear correlations of m6A levels among the m6A-circRNAs identified in both HeLa cells and hESCs. The linear regression fit equation is indicated in the top. The Pearson correlation coefficient and p-value are indicated at the top left corner. (D) The relationship between expression levels of circRNAs and m6A levels of circRNAs in HeLA cells (left) and hESCs (right). Expression levels are represented by back splice read counts of circRNAs in eluate and supernatant data. (E) Density distribution of transposable elements (TEs) flanking circRNAs. Eluate (red) contains circRNAs identified by m6A RIP (m6A-circRNA-enriched). Supernatant (blue) contains circRNAs not precipitated by m6A RIP (m6A-circRNA-depleted). Non-m6A-circRNAs (green) contains circRNAs identified in either HeLa or hESC supernatant that were not detected in either HeLa or hESC eluates. * indicates p<2.2e-16 compared to eluate.

