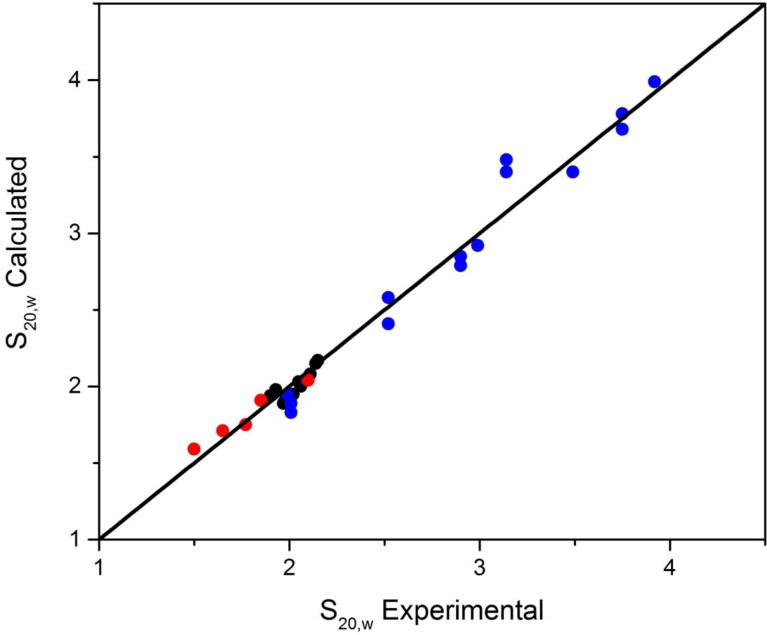
Figure 8.

Correlation of predicted and measured sedimentation coefficients. The points in red are for short DNA duplexes taken from Fernandes, et al., 2002). The black points are for known human telomere structures taken from (Le, et al., 2014). The blue points are for a variety of higher-order quadruplex structures determined in our laboratory.
