
Figure 1. Expressions levels of HEXIM1 in normal prostate and prostate cancer tissue.
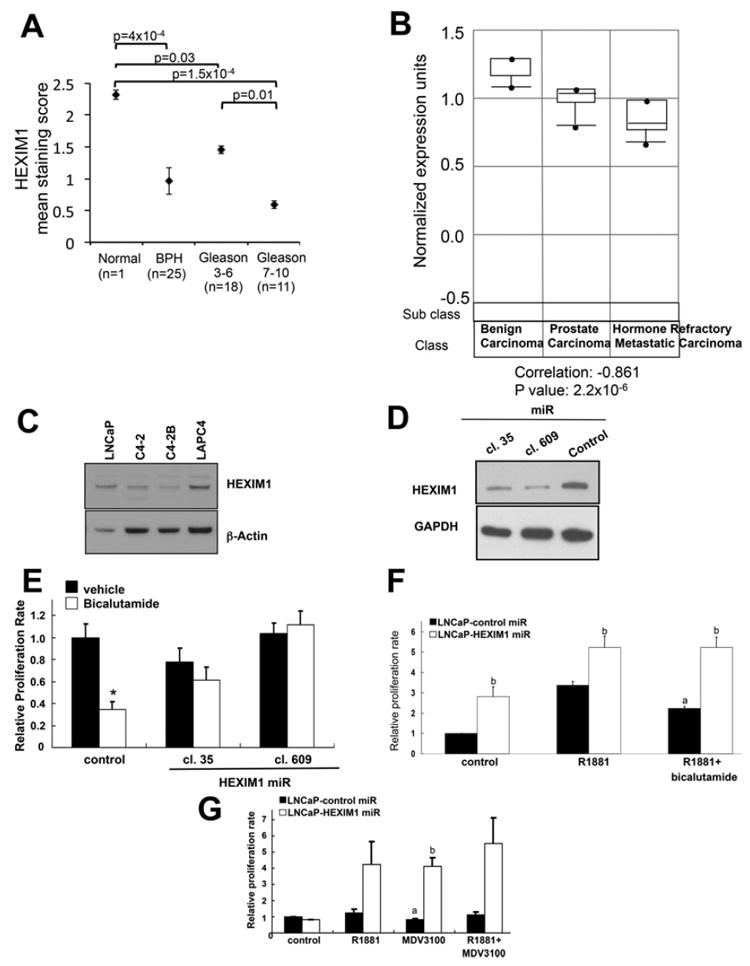
(A) Sections obtained from normal prostate tissues, BPH tissues and prostate tumour were stained for endogenous HEXIM1. The staining score was the product of the intensity of HEXIM1 nuclear staining and percentage of HEXIM1-positive cells. (B) Oncomine™ analyses of microarray gene expression of HEXIM1 in human benign carcinomas (n=6), prostate carcinomas (n=7) and hormone refractory metastatic carcinomas (n=6) [18]. For (A) and (B), P values were calculated using the Student’s t test. (C) Western blot analyses of HEXIM1 expression in LNCaP, LAPC4, C4-2 and C4-2B cells. LNCaP cells were stably transfected with control or two different HEXIM1miR clones separately (D and E) or together (F and G) and plated on to 94-well plates, treated as indicated for 6 days, then processed for MTT assays to assess proliferation. Figures are representative of at least three independent experiments. aP <0.05 relative to R1881 alone, bP <0.05 relative to control transfected cells with the same treatment and *P <0.05 relative to vehicle.