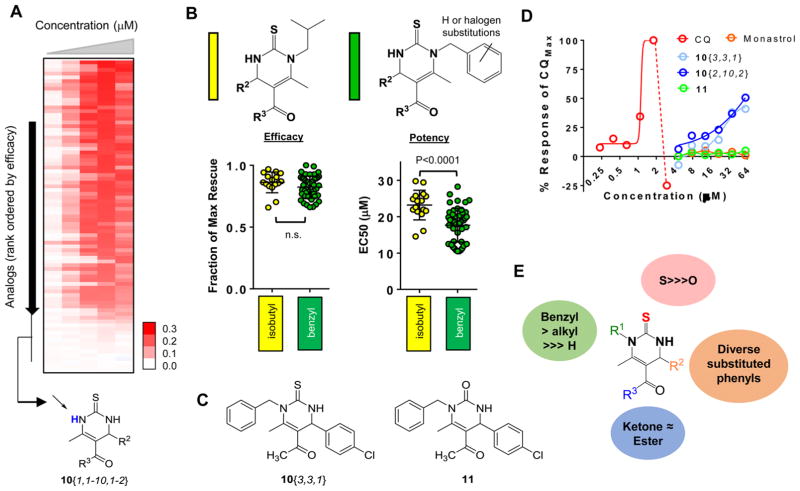
Figure 3.
Structure–activity relationships (SAR) of DHPM-thione series. (A) Heat map representation of the dose–response curves for 82 DHPM-thiones. Compounds are sorted from highest efficacy to lowest efficacy. Red indicates rescue (OD600 values), white indicates no rescue. Doses of compounds increased from left to right and range from 2 to 40 μM. The inactive cluster of R1-unsubstituted DHPM-thiones is indicated at the bottom of the heat map. (B) General structures of isobutyl and substituted/unsubstituted benzyl DHPM-thione analogues indicated in yellow and green, respectively, in the following plots. The left plot is efficacy and right plot is potency of all analogues falling within that substitution pattern. The y-axis for efficacy is fraction of maximal rescue by the series and the y-axis for potency is EC50 (μM). The indicated P-values were calculated according using a Student’s t test. (C) Structures of the thiourea analogue, 10{3,3,1}, and the urea variant, 11. (D) Dose–response curves of 10{3,3,1}, 11, CQ, and monastrol. X-axis is concentration (μM) on a log2 scale, and y-axis is % of the maximal CQ response. (E) Summary of SAR for R1, R2, R3, and S/O urea. While significant tolerability existed within the R1 and R2 groups, a benzylic substitution at the R1 group was preferred. The thiourea was required, as was at least an alkyl group at R1. Both ketone and ester groups were well-tolerated at R3.

