Figure 8.
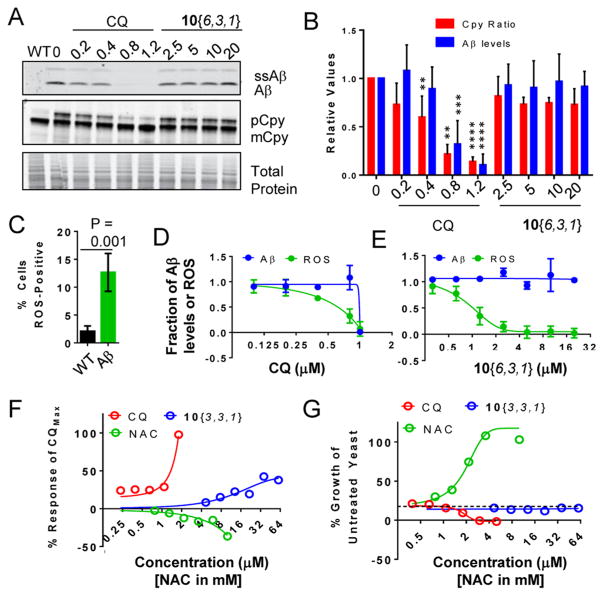
Effects of compounds on Aβ levels, vesicle trafficking, and ROS generation. (A) Western blot analysis of Aβ-expressing yeast treated with increasing doses of CQ or 10{6,3,1}. Top panel shows Aβ peptide (higher molecular band is the signal sequence-Aβ fusion prior to cleavage). The middle panel is Cpy, where the larger immature Cpy band reflects a block in trafficking to the vacuole. Bottom panel is a Coomassie stain of the top portion of the same gel used for blotting Aβ and Cpy to show equal protein load. (B) Quantitation of three independent experiments of (A). Data was normalized to total protein (quantified by total protein) and set to 1.0 for wild-type (Cpy) or Aβ/untreated (Aβ levels). P-Values according to a one-way ANOVA and Tukey’s test where P-values are **<0.01 and ***<0.001; ****<0.0001. (C) Detection of increased reactive oxygen species (ROS) in Aβ-expressing yeast compared to wild-type. Aβ was induced for 7 h and ROS detected by flow cytometry using a ROS-sensing dye (CM-H2DCFDA). Data are expressed as percent of cells that were ROS-positive after 7 h of Aβ expression. (D, E) Dose–response of CQ (D) and 10{6,3,1} (E) for both Aβ protein levels (blue) and ROS levels (green). Y-Axis is fraction of Aβ or ROS in the untreated condition. X-Axes are concentration (μM). (F) Dose–response curves for rescue of Aβ toxicity by CQ, 10{3,3,1}, or the antioxidant N-acetylcysteine (NAC). The y-axis is percent of maximal rescue by CQ. X-Axis is as in (D). Data indicate that a canonical antioxidant could not rescue Aβ toxicity. (G) Dose–response curves for growth of wild-type yeast treated with an ~80% lethal concentration of H2O2 in the presence of CQ (red), 10{3,3,1} (blue), or NAC (green). The y-axis is percent of growth of untreated wild-type yeast. X-Axis is as in (D).

