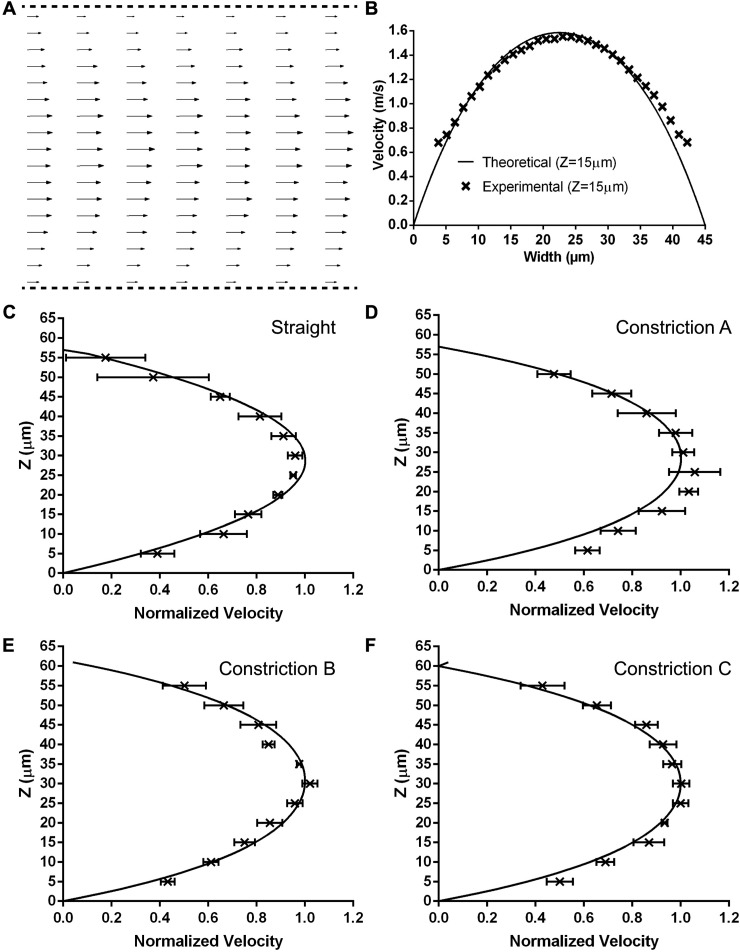
FIG. 3.
Velocity profiles of the different microfluidic channels. (a) The measured velocity vectors in the x-y position for a Type A constricted channel (shear rate = 98 000 s−1 exposure time = 16 ms). (b) Comparison of the experimental (x symbol) and theoretical (solid line) velocities at a height of 15 μm. The average, normalized velocity profiles with the Z position in comparison to the theoretical velocities (solid line) for a (c) straight channel, (d) Type A constricted channel, (e) Type B constricted channel, and (f) Type C constricted channel. The data represents the average of 3–5 experiments ± standard deviation at each z-plane.

