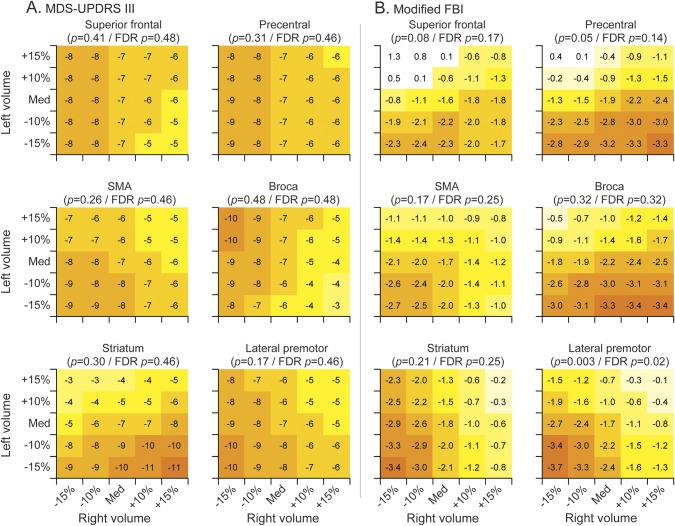
Figure 4. Heat maps of the relationship between baseline neuroimaging volumes and annual rate of decline for (A) MDS-UPDRS III and (B) modified FBI.
Each subplot indicates the rate of annual decline for a given left and right baseline volume. The combinations shown represent volumes ranging from 15% below the cohort median to 15% above the cohort median. Colors are comparable across subplots only for the same outcome measure because of differences in scale and rate of decline. FBI = Frontal Behavioral Inventory; FDR = false discovery rate; MDS-UPDRS III = Movement Disorders Society–sponsored revision of the Unified Parkinson's Disease Rating Scale part III; SMA = supplementary motor area.

