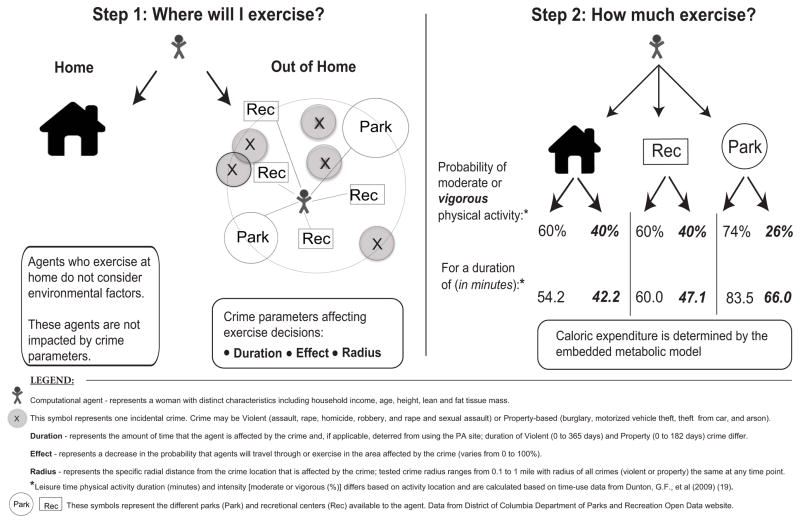
Figure 1.
Model Diagram
 Computational agent - represents a woman with distinct characteristics including household income, age, height, lean and fat tissue mass.
 This symbol represents one incidental crime. Crime may be Violent (assault, rape, homicide, robbery, and rape and sexual assault) or Property-based (burglary, motorized vehicle theft, theft from car, and arson).
Duration - represents the amount of time that the agent is affected by the crime and, if applicable, deterred from using the PA site; duration of Violent (0 to 365 days) and Property (0 to 182 days) crime differ.
Effect - represents a decrease in the probability that agents will travel through or exercise in the area affected by the crime (varies from 0 to 100%).
Radius - represents the specific radial distance from the crime location that is affected by the crime; tested crime radius ranges from 0.1 to 1 mile with radius of all crimes (violent or property) the same at any time point.
* Leisure time physical activity duration (minutes) and intensity [moderate or vigorous (%)] differs based on activity location and are calculated based on time-use data from Dunton, G.F., et al (2009) (19).

 These symbols represent the different parks (Park) and recretional centers (Rec) available to the agent. Data from District of Columbia Department of Parks and Recreation Open Data website.

