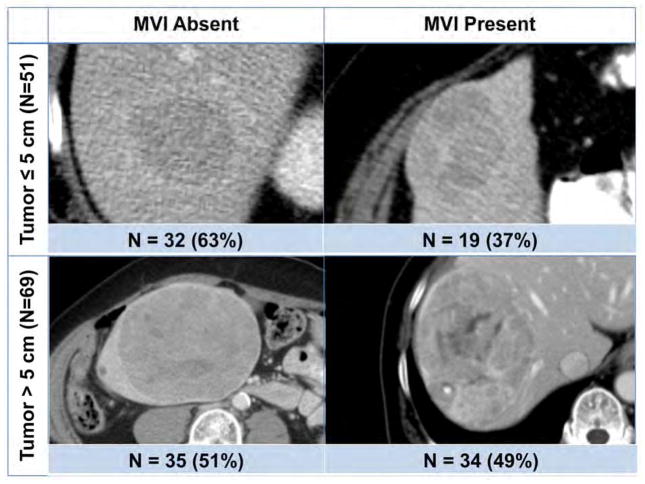
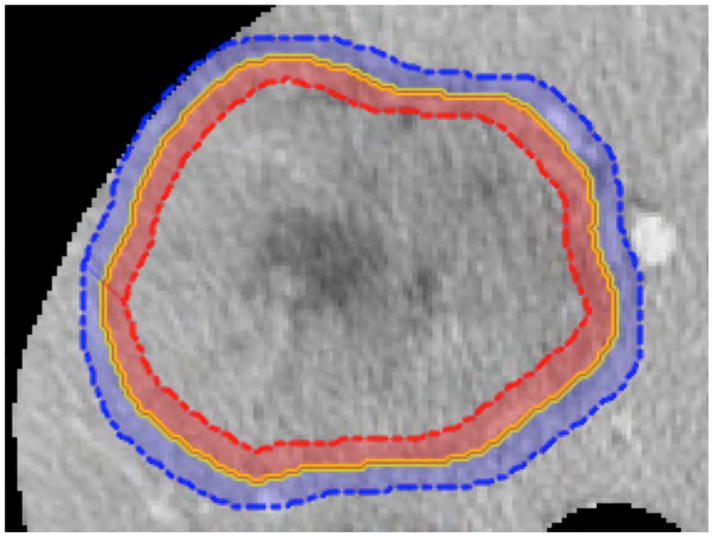
Figure 1.
(A) Quantitative image analysis was performed on tumor-liver interface, where 5 pixel-wide band inside the tumor margin (red shade on the tumor periphery) was subtracted from outside the tumor margin (blue shade on the adjacent hepatocytes). (B) The largest tumor from each patient was used to perform quantitative image analysis to predict microvascular invasion (MVI).


