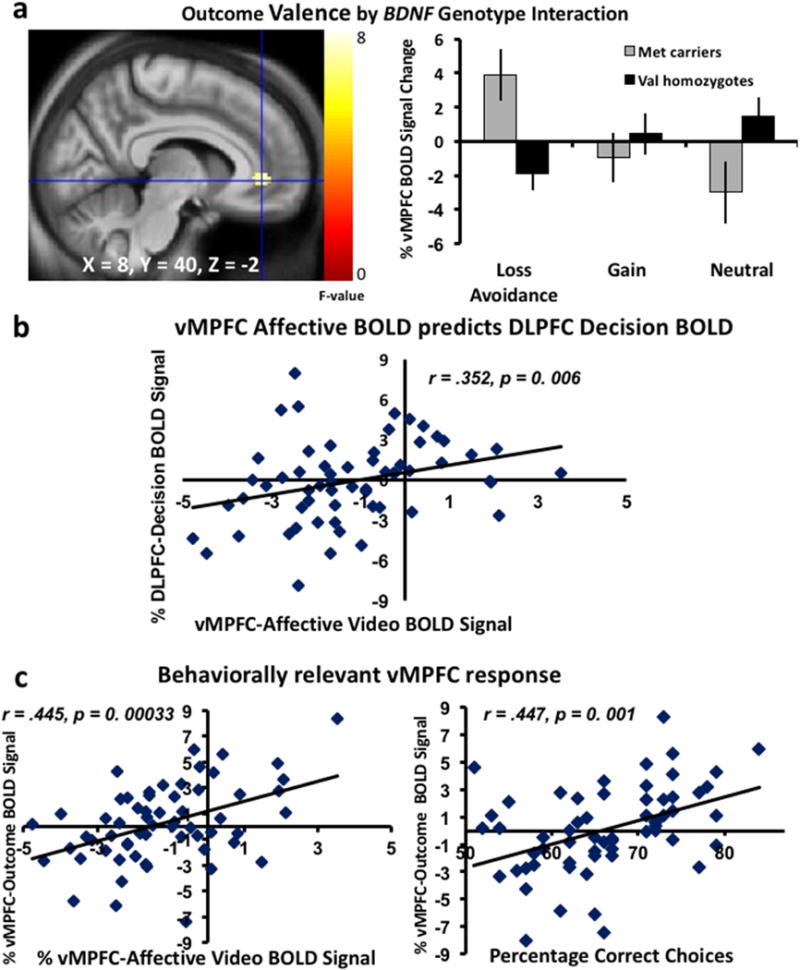
Figure 4. BOLD Response during Affectively-Cued Monetary Outcomes.

(a) Interaction between monetary outcome type and BDNF Val66Met genotype in vMPFC shown voxelwise and in a graph of values extracted from the a priori vMPFC ROI: BDNF Met carriers responded most robustly to loss/avoidance-of-loss outcomes and least to neutral outcomes, whereas the pattern was opposite in Val homozygotes (F2, 58 = 6.49, p < 0.002). (b) Scatter-plot illustrating the correlation between vMPFC BOLD responsivity to predictive affective cues and DLPFC BOLD responsivity to choice picture cues (r = .352, p = 0.006). (c) the left scatter-plot illustrates the correlation between the vMPFC BOLD response to predictive affective cues and the end-point outcome cues (r = .445, p = 0.00033). The right scatter-plot illustrates the correlation between vMPFC BOLD outcome cues and performance on picture choices (r = .417, p = 0.001). Color bars represent F-statistics; voxelwise images shown at p < 0.005 for display and X, Y, Z coordinates are in MNI space.
