Figure 3.

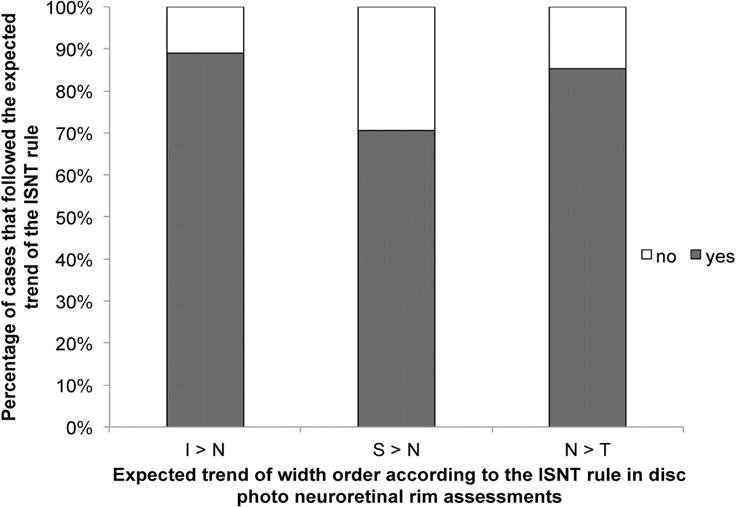
Bar graph showing the percentages of cases where the nasal quadrant did or did not follow the expected trend of the ISNT rule in disc photos. (Abbreviations: I = inferior; N = nasal; S = superior; T = temporal)

Bar graph showing the percentages of cases where the nasal quadrant did or did not follow the expected trend of the ISNT rule in disc photos. (Abbreviations: I = inferior; N = nasal; S = superior; T = temporal)