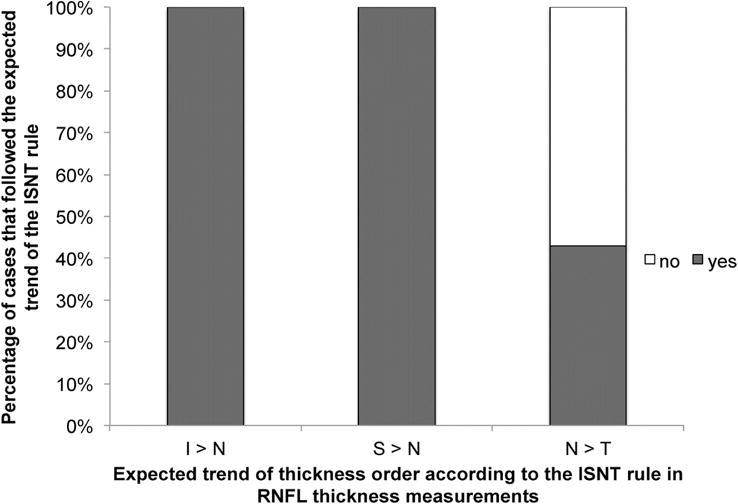
Figure 4.

Bar graph showing the percentages of cases where the nasal quadrant did or did not follow the expected trend of the ISNT rule for retinal nerve fiber layer thickness values. (Abbreviations: I = inferior; N = nasal; S = superior; T = temporal)
