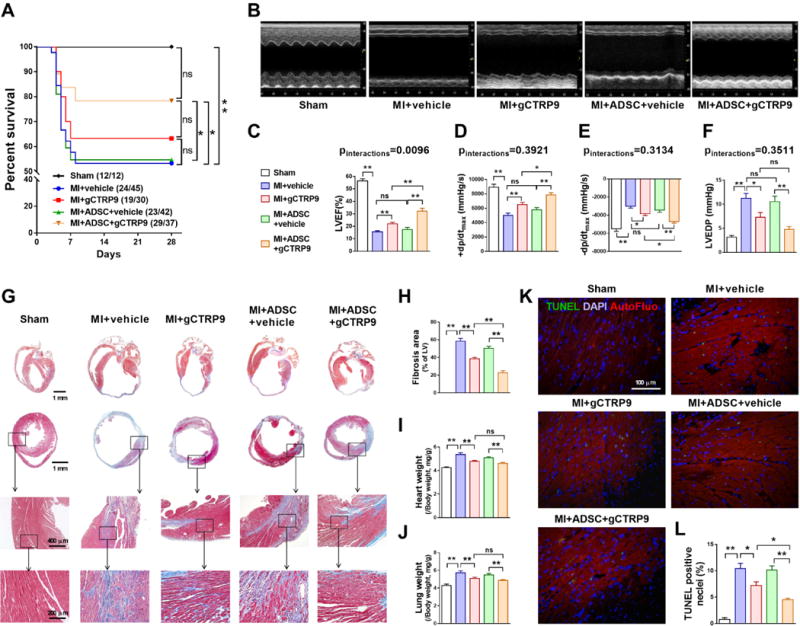
Figure 1. CTRP9 and ADSCs synergistically improved cardiac functional recovery, and reduced cardiac fibrosis and cardiomyocyte loss after MI.

A. Survival curves. n=12–45. B. Representative echocardiographic images 4 weeks after MI. C. Left ventricular ejection fraction (LVEF). n=10–18. D–F. Hemodynamic analyses including +dp/dtmax, − dp/dtmax, and LV end diastolic pressure (LVEDP). n=10–19. G. Representative images of Masson’s trichrome staining of the transverse and coronal planes. H. Quantification of fibrotic area. n=6–9. I. Heart weight to body weight ratio (HW/BW). J. Lung weight to body weight ratio (LW/BW). n=10–18. K/L. Representative images and quantification of TUNEL positive cardiomyocytes in infarct border zone 3 days after MI. Cell nuclei were stained with 4′-6-diamidino-2-phenylindole (DAPI; blue). n=6. Data are mean ± SEM. *P<0.05, **P<0.01. NS, not significant. Abbreviation: AutoFluo, Autofluorescence. Survival curves were analyzed by Gehan-Breslow-Wilcoxon test. LVEF and ±dp/dt were analyzed with two-way ANOVA followed by Bonferroni post-hoc test. Other data were analyzed with one-way ANOVA followed by Bonferroni post-hoc test.
