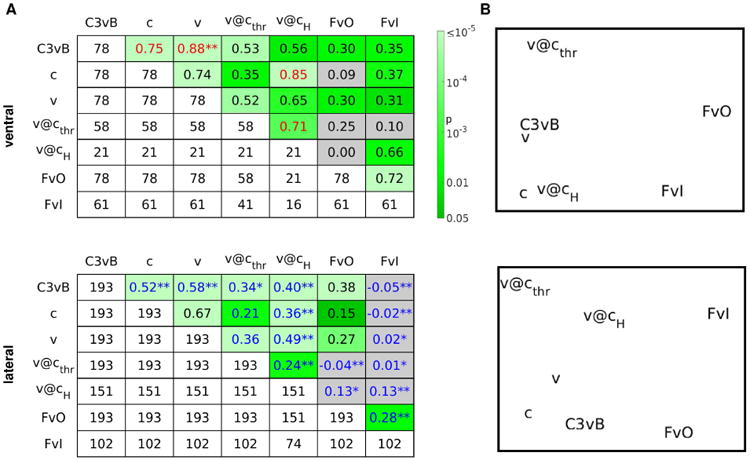
Figure 10. Similarity structure across different decoding analyses.

Correlation analysis between A′ values obtained in different decoding analyses for ventral (top) or lateral (bottom) electrodes. (A) Pearson correlation coefficients for each pair of decoding analyses are shown in the upper right part of the table, p-values for the null hypothesis of no correlation are shown color-coded from dark green (p<0.05) to pale green (p<10−5). Gray corresponds to p>0.05. Correlation coefficients are printed in red (blue) if higher (lower) than what would be expected by chance if region labels were irrelevant, at p<0.05 (*: p<0.01, **: p<0.001, uncorrected for multiple comparisons). Entries in the lower left part of the table show the number of electrodes that enter the corresponding correlation analysis. Diagonal entries indicate the number of face-responsive electrodes for which the assessment of the corresponding decoding accuracy A′ was possible. Correlation analyses were performed separately for ventral (top) and lateral (bottom) electrodes. (B) MDS representations of the correlation tables shown in A. C3vB: c3 vs. blank; FvO: upright face vs. other categories; FvI: upright vs. inverted face.
