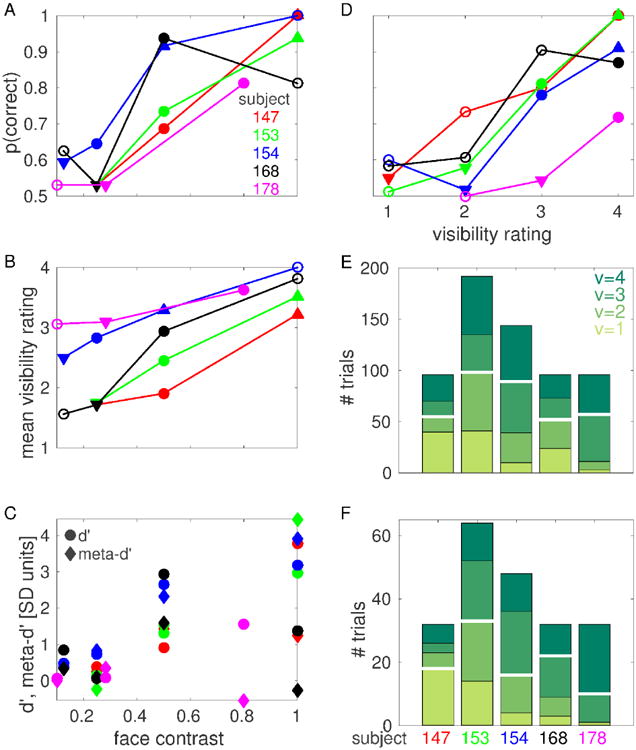
Figure 2. CFS behavioral results.

(A) Objective performance (probability of correct response) at each face contrast value for each subject. (B) Mean visibility rating at each face contrast value for each subject. In A and B, filled circles indicate threshold face contrast cthr, downward triangles indicate low contrast cL, upward triangles indicate high contrast cH. Downward triangles indicating cL coincide for subjects 147, 153 and 168 in panel A. (C) d′ (circles) and meta-d′ (diamonds) at each face contrast value for each subject. (D) Objective performance at each visibility rating for each subject. For each subject, only visibility ratings that were reported in at least 8 trials are shown. Filled circles indicate threshold visibility rating vthr, downward triangles indicate low visibility vL, upward triangles indicate high visibility vH. (E) Number of trials for each visibility rating for each subject. (F) Number of trials for each visibility rating at threshold face contrast for each subject. The number of trials for each visibility rating at each face contrast value for each subject is reported in Fig. S2. White horizontal lines in E, F indicate median splits.
