
Figure 4. Distilling the neural correlates of conscious visual perception: from physical attributes of stimuli to subjective phenomenology.
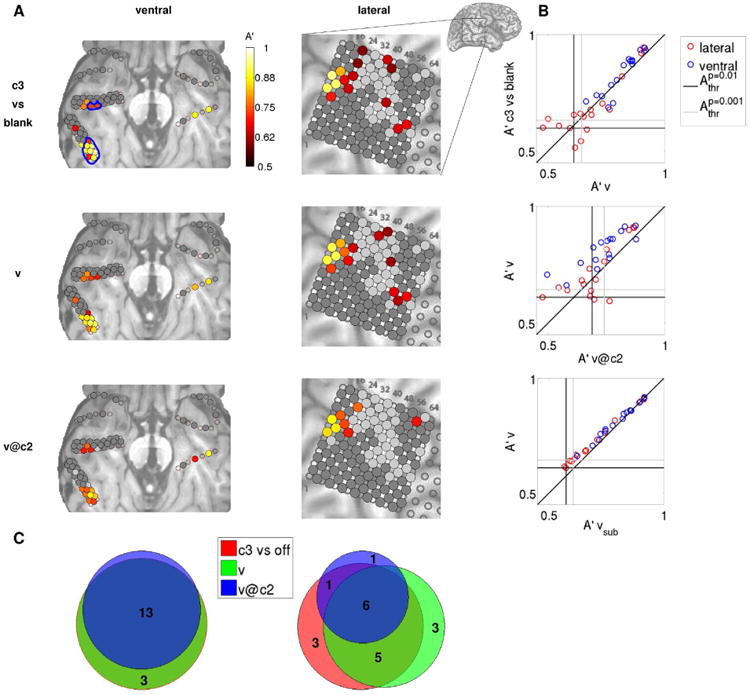
(A) Decoding accuracies A′ for each electrode in the example subject 153 are shown color-coded on the ventral (left) and lateral (right) brain images. The decoding analyses shown progress from a contrast specified by physical stimuli (c3 vs. blank, top row), to a contrast defined by subjective phenomenology, but contaminated by external factors (i.e., face contrast, v, middle row), to a purely subjective contrast (v@c2, bottom row). Only decoding accuracies that are significant at p<0.01 (uncorrected for multiple comparisons) are shown. Face-responsive ventral electrodes that are located in the fusiform gyrus are indicated with blue contours in the top left panel. Dark gray indicates non face-responsive electrodes; light gray indicates electrodes that are face-responsive but do not exhibit significant decoding accuracy. Decoding accuracies A′ for each electrode and for each remaining subject are shown color-coded on the anatomical images in Fig. S5. (B) Relationships between pairs of decoding analyses for each electrode that exhibits a significant A′ in either one of the two decoding analyses. There is a strong correlation between the decoding accuracy for c3 vs. blank and v, and between v and v@c2. vsub indicates the decoding accuracy obtained when decoding visibility using the same number of trials for training and test (for each round of cross-validation) as when decoding v@c2. The vertical (horizontal) black line indicates the p=0.01 significance threshold for the decoding analysis corresponding to the x (y) axis, averaged over electrodes. The vertical (horizontal) gray line indicates the p=0.001 significance threshold for the decoding analysis corresponding to the x (y) axis. Inset shows lateral brain image, with the area enlarged in the main panels indicated with a rectangle. (C) Venn diagrams showing the number of electrodes that are significant (p<0.01) in one or more of the decoding analyses considered, separately for ventral (left) and lateral (right) electrodes. The sets of ventral electrodes that discriminate c3 vs. blank and v (red and green circles) completely overlap for this subject. c3 vs. blank, red; v, green; v@c2, blue.