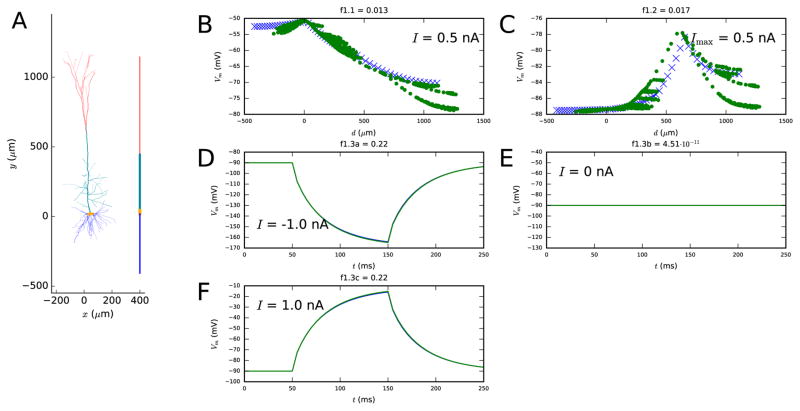
Figure 1. First step fit.
A: The reconstructed and reduced (fitted) morphology. B–F: Illustration on how well the reduced model (blue crosses and curves) approximates the behavior of the full model (green dots and curves) with regard to the objective functions. The panel B (objective 1.1) shows the membrane-potential values at each recorded location after a 3-second somatic DC injection, and the panel C (objective 1.2) shows the maximal membrane-potential values during or after an EPSP-like current injection at the apical dendrite. This current is injected at a 620 μm distance from the soma, and it has a double-exponential pulse shape with rise time 0.5 ms and decay time 5 ms. The panels D–F (objective 1.3) show the somatic membrane-potential time series as a response to somatic 100-ms DC pulses with three different amplitudes: the blue and green curves are tightly overlapping. The spatial coordinate d in objectives 1.1 and 1.2 represents the distance (along the dendrites) from soma — negative values are given to locations at the basal dendrite and positive to locations at the apical dendrite. Colors available in the online version of the article.

