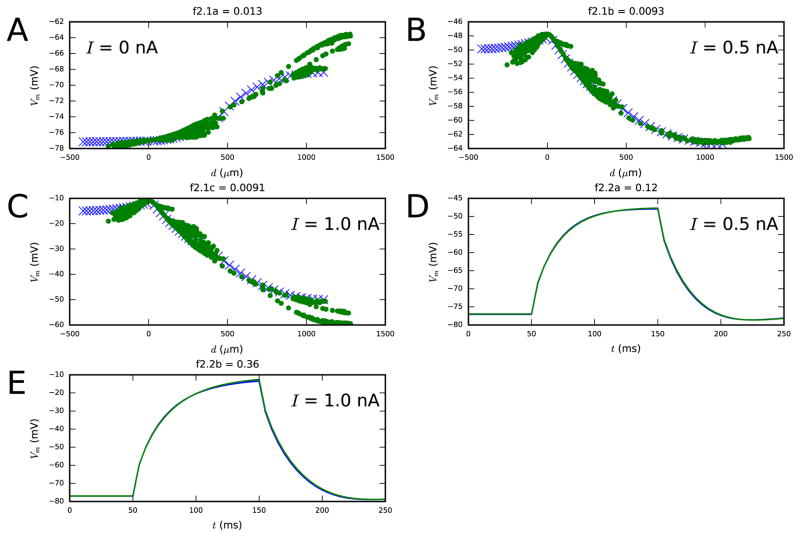
Figure 2. Second step fit.
Panels A–C show the membrane-potential distribution along the dendrites both at rest and as a steady-state response to long, somatic DCs with amplitudes 0.5 and 1.0 nA (objective 2.1). Panels D–E show the membrane-potential time series response to 100-ms somatic DCs of two different amplitudes (objective 2.2). Blue: reduced-morphology neuron, green: full-morphology neuron. Colors available in the online version.

