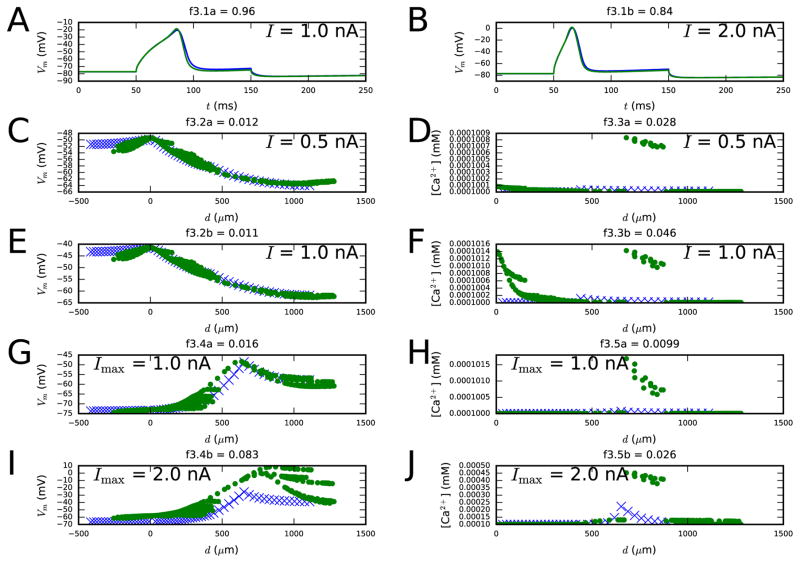
Figure 3. Third step fit.
Panels A–B show the membrane-potential time series as a response to 100-ms somatic DCs of two different amplitudes (objective 3.1). Panels C–F show the distributions of the steady-state membrane potentials (left) and Ca2+ concentrations (right) along the dendrites using long, somatic DC pulses with amplitudes 0.5 and 1.0 nA (objectives 3.2 and 3.3) as the stimulus. Panels G–J, in turn, show the distributions of the maximum membrane potential (left) and Ca2+ concentration (right) along the dendrites as a response to EPSP-like current injection (objectives 3.4 and 3.5). Blue: reduced-morphology neuron, green: full-morphology neuron. Colors available in the online version.

