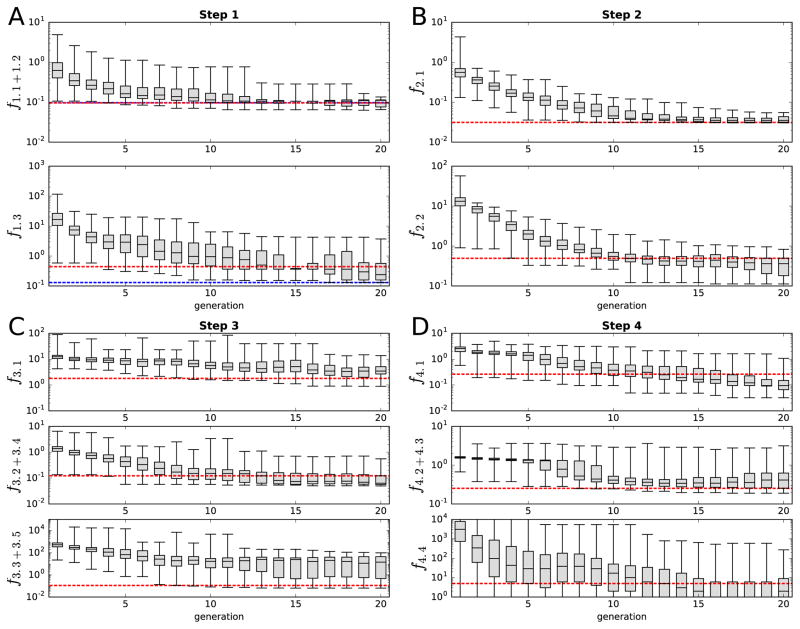
Figure 5. The evolution of the minimum, lower quartile, median, upper quartile, and maximum of the objective function values.
Panels A–D show the steps 1–4, respectively, and the separate subpanels show the values of the objective functions separately. The red dashed lines represent the objective function values of the final parameter set (see Figures 1–4). The blue dashed lines in panel A show the objective function values of the optimal parameter set chosen after the first step: the passive conductances are reassigned for the red dashed line parameters during the second step, otherwise the parameters are the same. The values of the minimal errors that are outside the plotted range in panel D represent zero values (number of spikes exactly same as in the target data for all three DC amplitudes). Colors available in the online version.

