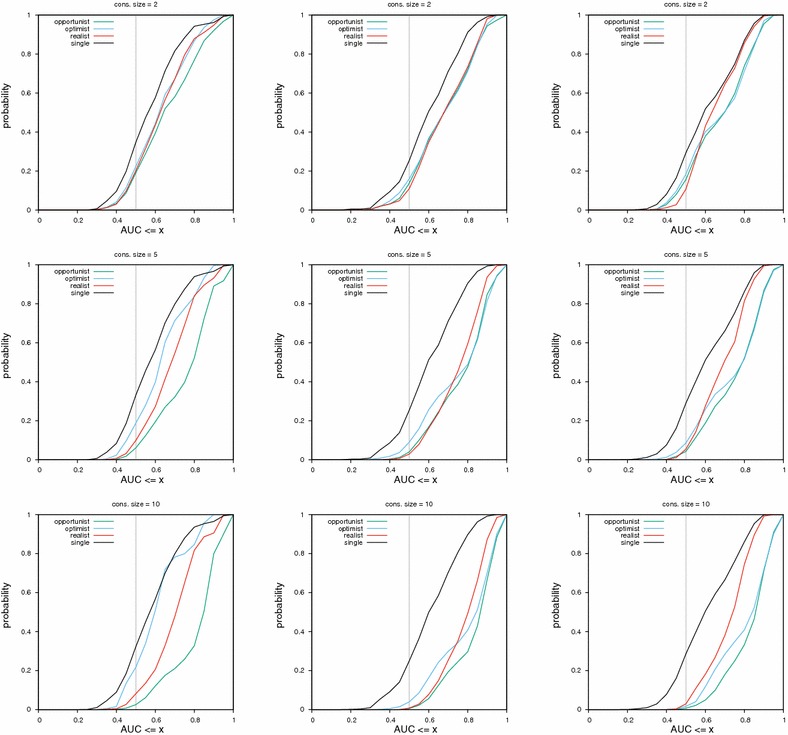
Fig. 4.

Cumulative distribution functions of AUC values for consensus of sizes two, five and ten. The consensus was built using MACCS fingerprints in the left column, ECFP4 fingerprints in the middle and UMOP2D fingerprints on the right. The lower a curve is, the better the corresponding method. The vertical gray bar at AUC 0.5 allows to find the least random method (lowest curve)
