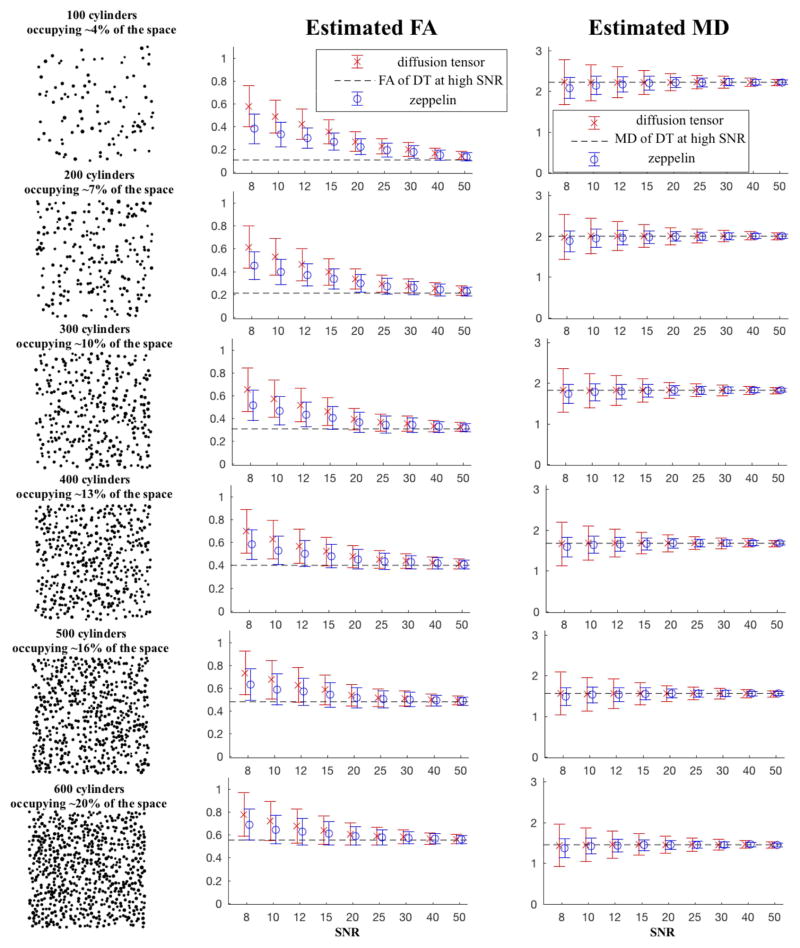
Figure 1.
Simulations using a substrate with different density of collagen fibrils, showing the variation of FA and MD across typical in vivo SNR. In the first column, each mesh substrate consists of cylinders randomly-spread in the cross-sectional plane, occupying area/volume fractions that vary from 4% to 20% of the whole plane/space. The distribution of (right circular) cylinders has a cross-section with mean radius R=75 nm. The second column is for FA and the third column is for MD; the circles represent the mean over 5,000 simulations (1000 instances of noise, 10 random realisations of the substrate, and 5 orientations of the b-matrix), with the bars showing standard deviation. Colour red denotes the DT values, and the blue denotes the zeppelin ones. The SNR references b0 signal, which at a b=300 ×103 ms/μm2 and diffusivity=2.5 μm 2/ms is attenuated by a factor of about 0.47. A typical SNR for in vivo experiments is about 25.

