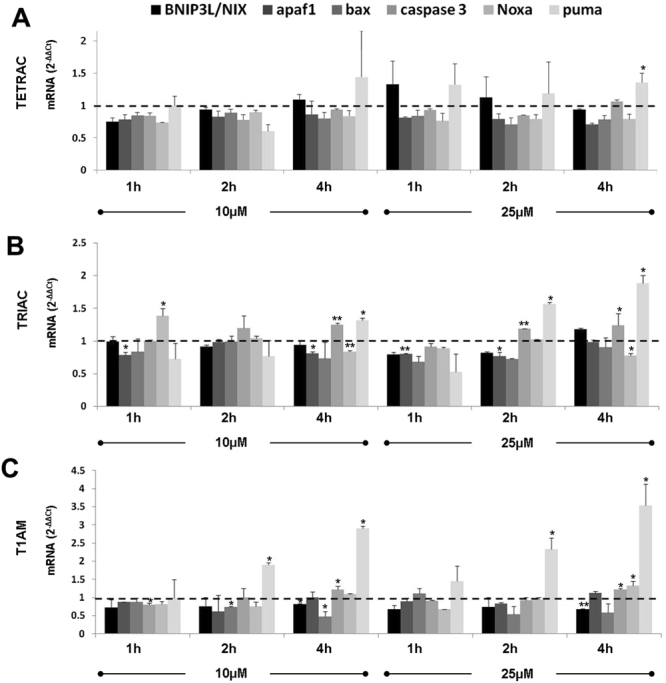
Figure 7.

Tetrac, triac and T1AM affect apoptotic gene expression. Cells were treated for 1–4 h with 10 or 25 μM of (A) tetrac, (B) triac (C) T1AM and mRNA levels were assessed by real-time PCR. Results were calculated as fold change using the comparative threshold cycle method (2-ΔΔCT) relative to control cells (that is, controls are arbitrarily assigned a value of 1). Experiments were repeated three times and are presented (average ± STDEV) as fold of control (1 ± STDEV, dashed line). *p < 0.05, **<0.005.
