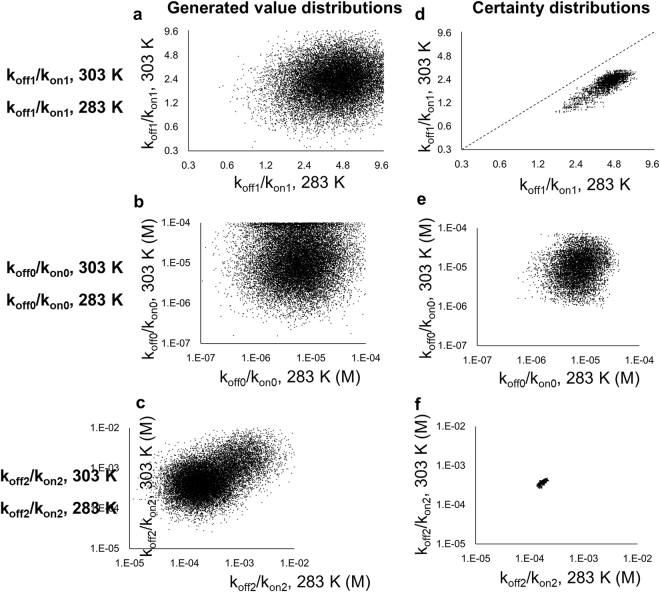
Figure 3.
Generated value distributions and certainty distributions of the equilibrium constants of the dynamic domain arrangement of the CheA-CheY complex. (a–c) Plots of the generated koff1/kon1 (a), koff0/kon0 (b), and koff2/kon2 (d) at 303 K against those at 283 K. (d–f) Plots of the certainty distributions of koff1/kon1 (d), koff0/kon0 (e), and koff2/kon2 (f) at 303 K against those at 283 K. In (d–f), data during the burn-in period were excluded from the plots. At the dotted line in (d), koff1/kon1 at 303 K equals that at 283 K.

