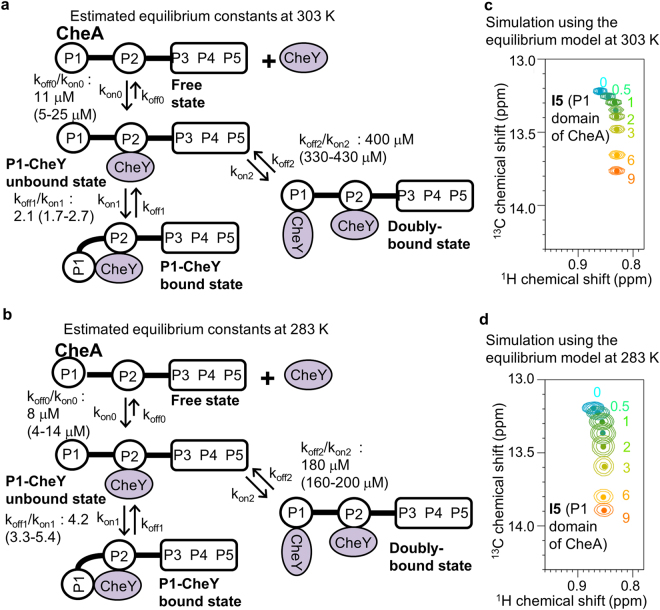
Figure 4.
Temperature-dependent shift of the equilibrium of the CheA-CheY complex. (a,b) Estimated equilibrium constants and their standard deviations at 303 K (a) and 283 K (b), determined by the Markov chain Monte Carlo algorithm. (c,d) are overlaid resonances from the methyl group of I5 of CheA, in the presence of various concentrations of CheY, simulated using the equilibrium constants in (a,b), respectively, with the same colors as in Figs 1d and 2a.

