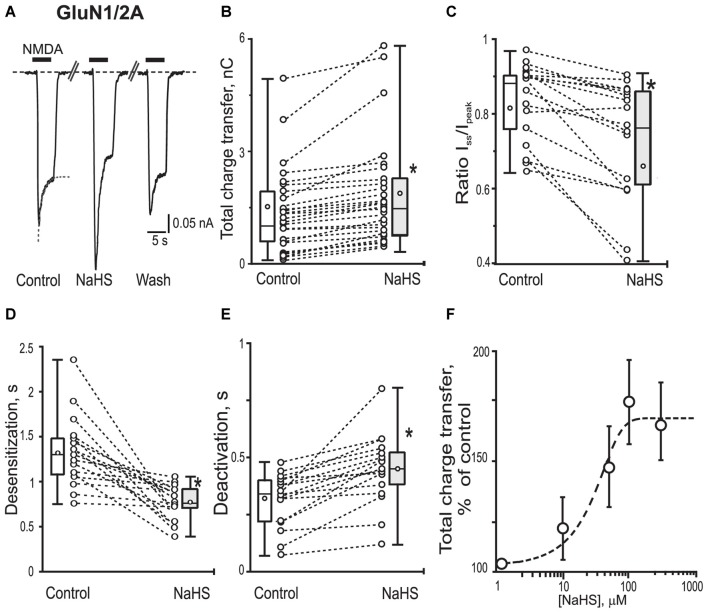
Figure 2.
Effects of NaHS on recombinant GluN1/2A containing NMDA receptors expressed in HEK293T cells. Representative current traces recorded in HEK293T cells expressing GluN1/2A activated by application of 100 μM NMDA + 30 μM glycine (5 s, black bar) in control, in the presence of 100 μM NaHS and after washout (A). Dotted lines in control trace represent a fit of a single exponential function to current decay. Statistical plots of the total charge transfer (B; n = 28), the Iss/Ipk ratio (C; n = 17), desensitization time (D; n = 17) and deactivation time (E; n = 17) of NMDA evoked currents through GluN1/2A receptors in control and in the presence of NaHS. Each pair of connected circles corresponds to an individual HEK293T cell expressing GluN1/2A. Boxes indicate 25–75 percentiles in control (white) and in NaHS (gray), black line—median, the circle inside—mean value, whiskers—minimal and maximal values. (F) Dose dependent effects of NaHS on the total charge transfer in recombinant GluN1/2A receptors. Each point represents the mean value and SEM. Data points were fitted using the dose-response equation (stippled line) with EC50 = 49 ± 18 μM (n = 6). *p < 0.05, paired W-test.

