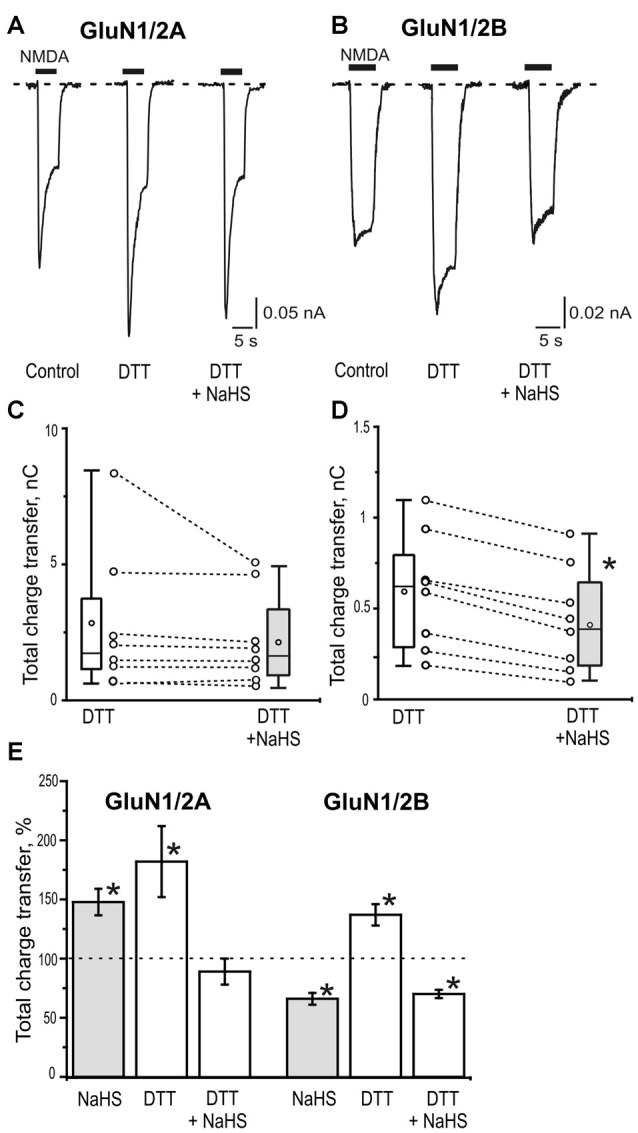
Figure 4.

The role of disulfide bonds reduction in the effects of NaHS on GluN1/2A and GluN1/2B receptors. Representative current traces activated by 100 μM NMDA + 30 μM glycine (5 s, black bar) in control, after application of 2 mM dithiothreitol (DTT) and 2 mM DTT+100 μM NaHS in HEK293T cells expressing GluN1/2A (A) or GluN1/2B (B) receptors. Statistical plot of NMDA induced total charge transfer in the presence of 2 mM DTT and DTT+NaHS. Each pair of connected circles corresponds to an individual HEK293T cell expressing GluN1/2A (C; n = 8) and GluN1/2B (D; n = 8). Boxes indicate 25–75 percentiles in control (white) and in NaHS (gray), black line—median, the circle inside—mean value, whiskers—minimal and maximal values, *p < 0.05, paired W-test. (E) Total charge transfer of NMDA evoked currents in HEK293T cells expressing GluN1/2A (n = 8) or GluN1/2B (n = 8) receptors after application of NaHS (100 μM) and DTT (2 mM) each normalized to its own control (dotted line) and DTT+ NaHS each normalized to total charge transfer after DTT (dotted line). *p < 0.05 compared to control, paired W-test.
