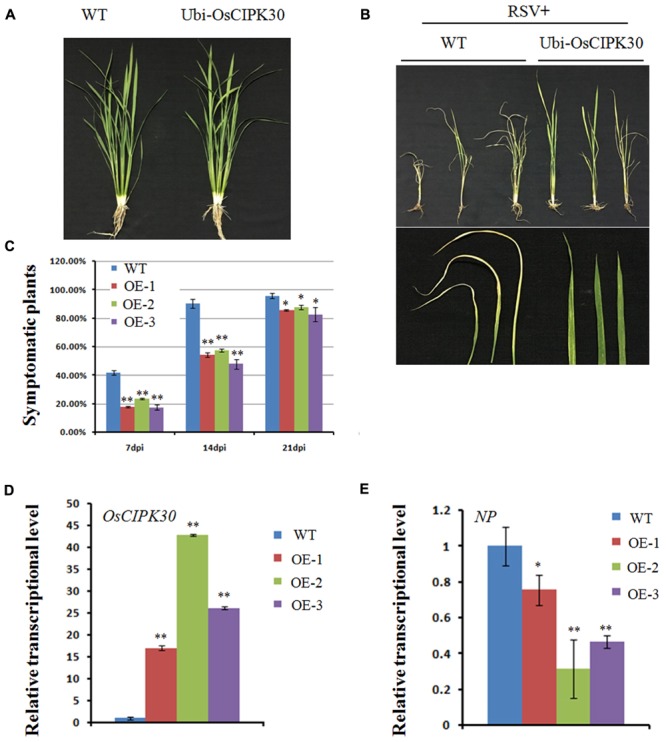
FIGURE 5.

Effect of OsCIPK30 overexpression on RSV infection in rice. (A) Growth of the WT and Ubi-OsCIPK30 transgenic rice (T1 generation). (B) WT and Ubi-OsCIPK30 T1 transgenic rice were inoculated with RSV and photographed at 21 dpi. The lower panel of (B) shows the symptomatic leaves of the representative plants. (C) Temporal changes of RSV symptom development in WT and Ubi-OsCIPK30 T1 transgenic rice (OE-1, OE-2, OE-3). Thirty plants were used for each treatment in the experiment. (D) The expression level of OsCIPK30 in T1 transgenic rice (OE-1, OE-2, OE-3) by real-time RT-PCR at 21 dpi with RSV. The relative mRNA levels were calculated with respect to the expression level of the corresponding transcript in the WT rice plant. (E) The expression level of NP in T1 transgenic rice (OE-1, OE-2, OE-3) by real-time RT-PCR at 21 dpi with RSV. The relative mRNA levels were calculated with respect to the expression level of the corresponding transcript in the WT rice plant. All the experiments were repeated three times, and similar results were obtained. The data represent the means ± SD of triplicate measurements. The asterisks above the columns represent significance based on an unpaired, two-tailed Student’s t-test relative to the WT. ∗∗P < 0.01; ∗P < 0.05.
