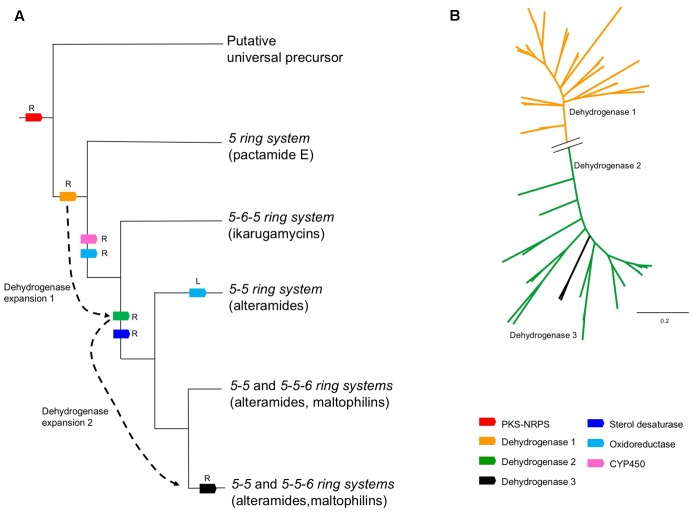
FIGURE 6.
Biosynthetic evolution of PTMs. (A) Reconstruction of the evolutionary events leading to the chemical diversity of PTMs. The branches of the cladogram show the products of each evolutionary event. Gene recruitment events are indicated with an R, and gene losses with an L. Dotted arrow indicate expansions of the PTM dehydrogenases gene families, which led to major changes in ring composition in PTMs. (B) Phylogenetic reconstruction of PTM dehydrogenases. A broken line in the tree indicates the distant relationship between dehydrogenases in clades 1 and 2. Recently evolved family 3 is likely derived from a duplication event in family 3.

