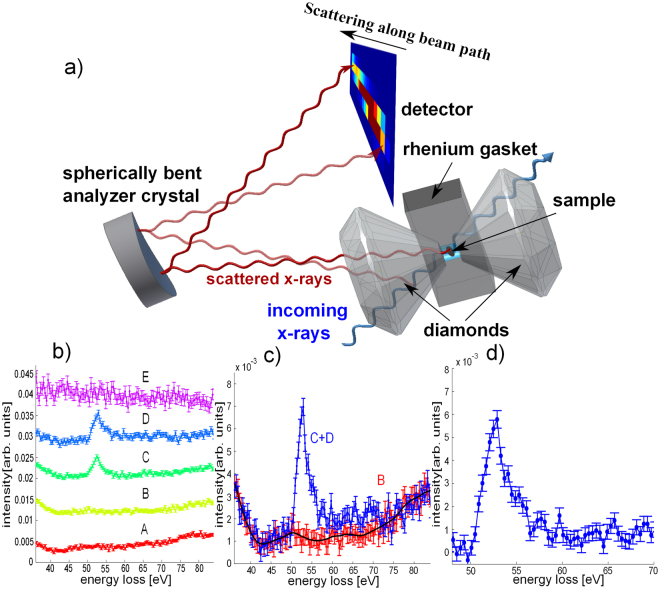
Figure 1.
Imaging properties of XRS and data extraction. (a) Schematic sketch of the scattering geometry for the high pressure XRS measurements. The inelastically scattered photons from each point of the x-ray beam path through sample and diamond are analyzed and focused onto different positions on the 2D detector. (b) XRS spectra for energy losses at the iron M2,3-edge obtained from a single pixel analysis along the beam path. Spectra A and B show the signal of the diamond before the sample, curves C and D contain contributions from diamond and sample and spectrum E shows the signal of the diamond behind the sample, which is partly masked by the gasket. (c) Summed signals for selected pixels which contain the background signal only (red, B) and spectra from pixel that contain sample and background signal (blue, summation of pixel C & D). The black solid line indicates the smoothed background signal. (d) Extracted XRS M2,3-edge after subtraction of the smoothed background.

