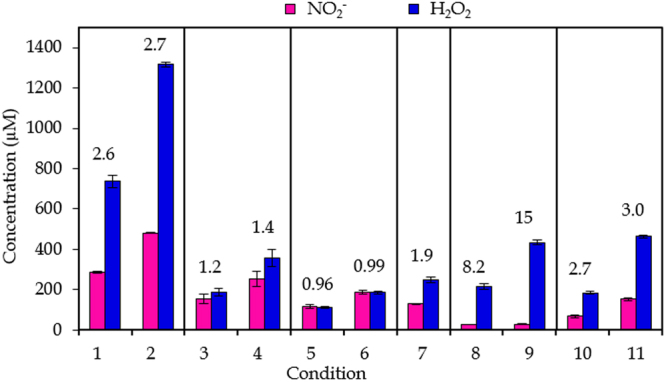
Figure 1.

Results for chemical composition. Concentrations of NO2 − and H2O2 in pPBS at the 11 plasma treatment conditions listed in Table 1. Conditions for which only the plasma treatment time differs are indicated within one frame. The concentrations are plotted as the mean of at least three repetitions, and the error bars indicate the standard deviations of the mean. The numbers above the signals indicate the ratio of the concentration of H2O2 to the concentration of NO2 − for that condition.
