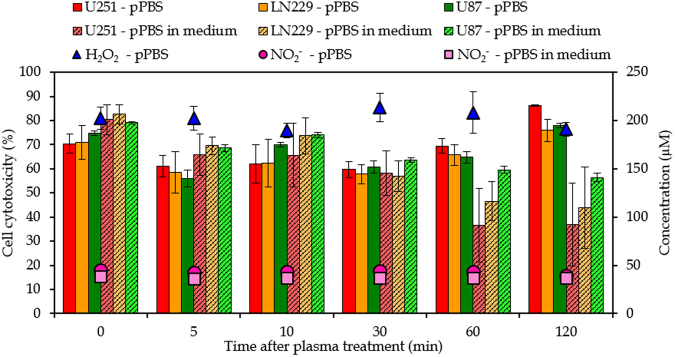
Figure 8.
Stability of pPBS and pPBS with medium. Concentrations of NO2 − and H2O2 (right y-axis) and cell cytotoxicity of the three cell lines (left y-axis) as a function of time after treatment, to evaluate the stability of pPBS and of pPBS with medium, for a gap of 15 mm and a gas flow rate of 1 slm (i.e., condition 3 of Table 1). The concentrations and percentages are plotted as the mean of at least three repetitions, and the error bars indicate the standard deviations of the mean.

